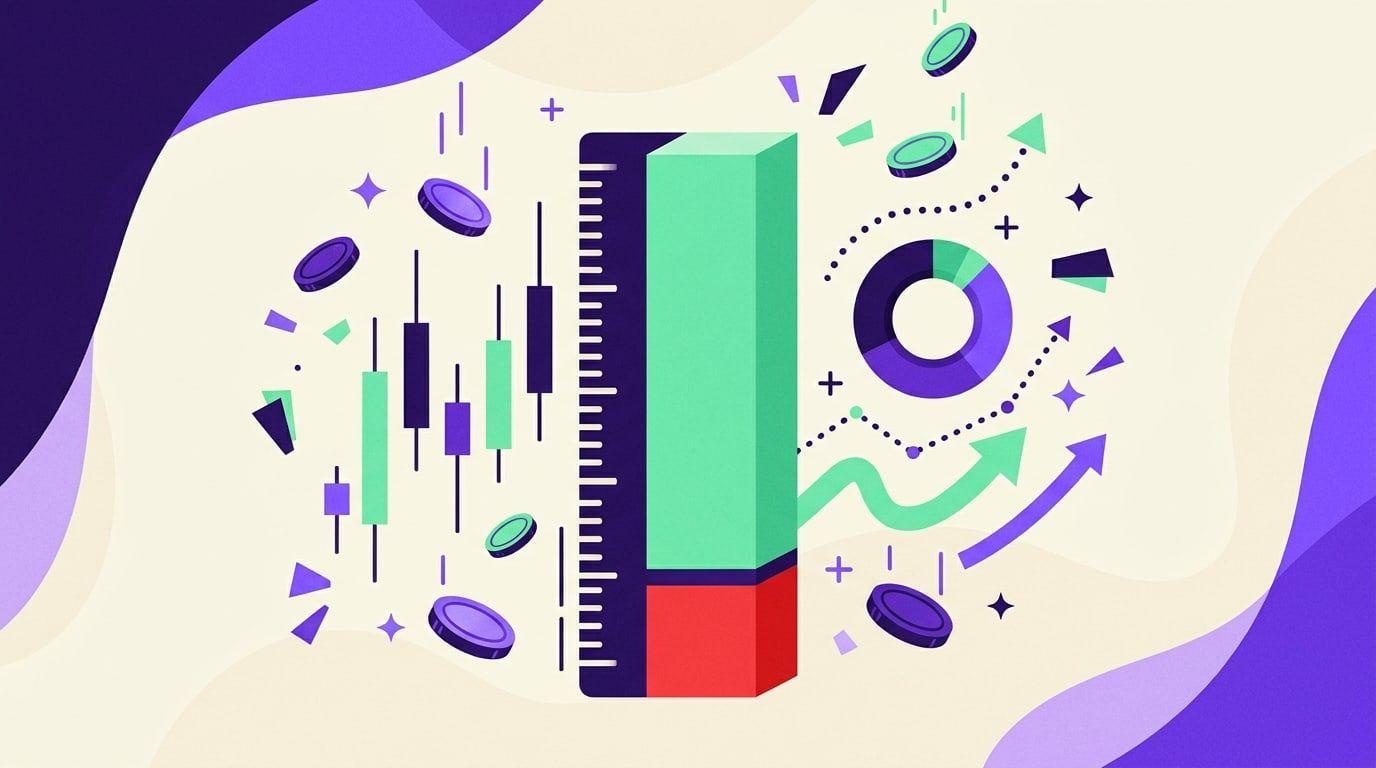
The risk-reward ratio compares what a trade can lose (the distance from your entry to your stop) with what it aims to make (the distance from your entry to your target). A 1:2 ratio means you risk 1 to make 2. On its own the ratio tells you nothing about profit. It only becomes useful next to your win rate: the win rate you need to break even is 1 ÷ (1 + reward-to-risk), so a 1:2 trade needs to win 33.3% of the time and a 1:1 trade needs 50%, both before fees.
This guide shows the math, why a bigger ratio is not automatically better, how fees quietly shrink the ratio, and what the ratio does to your nerves during a losing streak. It ends with real numbers from 120 backtests.
- Break-even win rate = 1 ÷ (1 + reward-to-risk): 50% at 1:1, 33.3% at 1:2, 25% at 1:3, before fees.
- Expectancy joins both numbers: win rate × average win minus loss rate × average loss. Above zero, the method earns over many trades.
- Distant targets are hit less often, so raising the ratio usually lowers the win rate.
- Fees count against both sides. With a tight stop, a planned 1:2 can need a 40% win rate instead of 33.3%.
- Low win rates mean long losing streaks: at a 25% win rate, the typical worst run in 100 trades is 12 losses in a row.
What the risk-reward ratio means
Every planned trade has three prices: the entry, the stop (where you admit the idea was wrong) and the target (where you take profit).
- Risk = distance from entry to stop.
- Reward = distance from entry to target.
- Risk-reward ratio = risk : reward, usually written with the risk as 1.
Say you buy a coin at 50.00 USDT, put the stop at 48.00 and the target at 54.00. The risk is 2.00, the reward is 4.00, so the ratio is 1:2. For a short it works the other way round: sell at 50.00, stop at 51.00, target at 47.00, and the risk is 1.00 against a reward of 3.00, a 1:3 ratio.
One trap is the notation. Some write risk first (1:2), others write reward first (2:1), and broker guides such as CMC Markets' explainer define it as the profit target divided by the risk while still writing it as 1:2. They all describe the same trade. This guide always puts the risk first, and calls the second number the reward-to-risk.
The ratio does not tell you how much money is at stake. That is a separate decision: you choose how much of the account one stop may cost (for example 1% or 2%), and the stop distance then sets the position size. Our guide on how to calculate position size walks through it. Traders call that fixed amount 1R, and measure every result in R: a full stop is -1R, a trade that reaches a 1:2 target is +2R.
The break-even win rate for each ratio
If every loss is 1R and every win is the reward-to-risk (call it W), you break even when the wins pay for the losses. That happens at a win rate of 1 ÷ (1 + W).
| Risk-reward ratio | Break-even win rate, before fees |
|---|---|
| 1:0.5 | 66.7% |
| 1:1 | 50.0% |
| 1:1.5 | 40.0% |
| 1:2 | 33.3% |
| 1:3 | 25.0% |
| 1:4 | 20.0% |
| 1:5 | 16.7% |

Anywhere above the curve, a method makes money before costs; anywhere below, it loses. The curve is why a strategy that wins only a third of its trades can still be fine, and why one that wins 60% can still lose money.
Expectancy: win rate and ratio in one number
The cleaner way to judge a method is its expectancy, the average result per trade:
Expectancy = (win rate × average win) − (loss rate × average loss)
In R, with losses of 1R:
- 40% win rate at 1:2: 0.40 × 2 − 0.60 × 1 = +0.2R per trade
- 60% win rate at 1:1: 0.60 × 1 − 0.40 × 1 = +0.2R per trade
- 20% win rate at 1:3: 0.20 × 3 − 0.80 × 1 = −0.2R per trade
The first two methods earn the same on average in very different ways. The third has the most attractive ratio and loses money, because its targets are too rarely reached.
Why a bigger ratio is not automatically better
A popular rule says to take only trades of 1:3 or better. The math above shows the catch. A target three times as far away as the stop is harder to reach than one at the same distance, so the win rate drops as the ratio rises. Forex.com's trading course puts it plainly: a close profit target is more likely to be hit than a distant one, so 1:3 and 1:4 setups generally produce far fewer winners than 1:1 or 1:2, and there is no golden ratio that works for every trader.
So the question is never "is 1:3 better than 1:1?" It is "at this ratio, is my real win rate above the break-even line?" You only know that from a record of trades: your own journal, or a backtest that uses the same stop and target rules.
Fees shrink the ratio, most of all with tight stops
Fees work against both sides of the ratio. They make every loss bigger and every win smaller. Take 0.05% commission per side, the rate our own backtests assume, so 0.1% of the position for the round trip, and plan every trade at 1:2:
| Stop distance | Target distance | Loss with fees | Win with fees | Real ratio | Break-even win rate |
|---|---|---|---|---|---|
| 2% | 4% | 2.1% | 3.9% | 1:1.86 | 35.0% |
| 1% | 2% | 1.1% | 1.9% | 1:1.73 | 36.7% |
| 0.5% | 1% | 0.6% | 0.9% | 1:1.50 | 40.0% |
All three are "1:2 trades" on the chart. With a tight stop, fees eat so much of the edge that the trade needs a 40% win rate instead of 33.3%, and that is before slippage, which tends to hit stop orders in fast markets, and before funding fees on futures. The tighter the stop, the more the costs matter.
Planned vs realized: what a real backtest shows
The ratio you plan at entry is not the ratio you end up with. Partial exits, stops moved to breakeven, reversals and fees all change it. That is why trading reports show the realized version: TradingView's strategy report divides the average winning trade by the average losing trade, from closed positions only.
Here is what that looks like on the published backtest of Navixa Price Action: Bitcoin perpetual futures on Binance (BTCUSDT.P), 4-hour candles, October 2019 to October 2026, 2% risk per trade, 0.05% commission per side and 5 ticks of slippage. Every trade sets its stop and two targets at entry; part of the position closes at the first target, and the stop on the rest then moves just past the entry.
| Figure from the TradingView report | Value |
|---|---|
| Trades (one row per exit, from 58 positions) | 115 |
| Percent profitable | 71.30% (82 of 115) |
| Average win | 114.20 USDT |
| Average loss | 113.92 USDT |
| Average win / average loss | 1.002 |
| Profit factor | 2.491 |
| Expectancy | 48.74 USDT per trade |
| Largest loss | 210.97 USDT, which is -1.0R, the planned risk |
The realized ratio came out at almost exactly 1:1, the ratio many guides tell you to avoid. The strategy was still profitable, because 71.30% of its trades won, far above the 50% break-even line for 1:1. Plug the numbers into the expectancy formula and you get the report's own figure: 0.713 × 114.20 − 0.287 × 113.92 ≈ 48.7 USDT per trade.
Two details explain the shape. First, 38% of positions reached the first target and then closed the rest at the moved stop near the entry, which adds many small wins: a high win rate, a modest average win. Second, no loss was bigger than the planned 1R, while the best position made +5.3R. Per position, the average came to +0.40R. The win rate did the heavy lifting, and the fixed stop kept the losses from undoing it.
Does a high win rate always win, then? No. We ran the same strategy with default settings on the 40 largest coins by market cap (stablecoins and wrapped tokens excluded) on the 1-hour, 2-hour and 4-hour charts, 120 tests in all, and 94 of them made money.

The overlap is the lesson. The tests that made money won between 52% and 79% of their positions; the tests that lost money won between 37% and 65%. Of the 65 tests that won 55% to 65% of their positions, 17 still lost money. ATOM on the 4-hour chart won 64% of 55 positions and lost money (profit factor 0.88). ETHFI on the 2-hour chart won only 53% and made money (profit factor 1.64), though from just 17 positions. At the same win rate, the size of the wins against the losses decided the result. Profit factor, gross profit divided by gross loss, captures both at once: above 1 a method made money, below 1 it lost. Every test is listed on the Price Action results page.
The psychology: losing streaks and early exits
The ratio you choose also decides what trading will feel like. A low win rate with a big ratio can be just as profitable as a high win rate with a small one, but it comes with much longer runs of losses. Assuming independent trades and a steady win rate, here is the longest losing streak to expect in 100 trades:
| Win rate | Typical longest losing streak in 100 trades | Chance of 8+ losses in a row | Chance of 10+ losses in a row |
|---|---|---|---|
| 70% | 3 | 0.4% | 0.04% |
| 60% | 4 | 3.6% | 0.6% |
| 50% | 6 | 17% | 4.4% |
| 40% | 7 | 49% | 20% |
| 33.3% (break-even at 1:2) | 9 | 75% | 44% |
| 25% (break-even at 1:3) | 12 | 96% | 79% |
"Typical" is the median: in half of all runs of 100 trades the worst streak is at least that long. At a 25% win rate, twelve losses in a row is not bad luck, it is normal, and at 2% risk per trade twelve straight stops cost about 22% of the account. Many traders abandon a sound 1:3 method in the middle of such a streak, right before the wins that pay for it. For comparison, the longest losing streak in the Bitcoin backtest above, with its 71% win rate, was 2.
The other psychological drag runs in the opposite direction. In a study of 10,000 brokerage accounts, Terrance Odean found investors had a strong preference for realizing winners rather than losers, the disposition effect. In trading terms: closing winners before the target shrinks your realized reward, and holding losers past the stop grows your realized risk. Both drag the ratio down, and neither shows up in the plan, only in the record. If the realized win rate and ratio in your journal end up below the curve, this is the first place to look.
Never move a stop further away once a trade is open. It increases a risk you already sized for, and a trade that was 1:2 at entry quietly becomes 1:1 or worse. If the stop no longer makes sense, close the trade instead.
How to use the ratio on your next trade
- Set the stop where the idea is wrong, beyond the level that would invalidate the setup, not at whatever distance makes the ratio look good. A stop squeezed tight to improve the ratio just gets hit by normal noise.
- Pick a target the chart can justify, such as the next clear support or resistance, or the height of the pattern you are trading. Then work out the ratio.
- Compare it with your real win rate after fees. Use the break-even table and the fee table above. If your record says you win 40% of the time, a 1:1.5 trade is a break-even trade before costs and a losing one after.
- Size the position from the stop, so a full stop costs the same fixed share of the account every time.
- Place the stop and target as orders at entry, and leave them alone.
- Log every result in R. After 30 to 50 trades you will know your realized ratio and win rate, which is worth more than any rule of thumb.
FAQ
What is a good risk-reward ratio for crypto?
There is no single good ratio, because it only means something next to a win rate. Many traders start from 1:2 or better, which breaks even at 33.3% before fees. A 1:1 ratio can work just as well with a win rate well above 50%. Check your own numbers against the break-even table, after fees.
Is a 1:1 risk-reward ratio bad?
Not by itself. It needs a win rate above 50% plus enough margin to cover fees. The Bitcoin backtest above realized almost exactly 1:1 and was profitable because 71.30% of its trades won.
What is the difference between the risk-reward ratio and the profit factor?
The risk-reward ratio describes one planned trade. The profit factor describes a whole series of closed trades: gross profit divided by gross loss. It already combines the win rate and the realized size of wins and losses, so it is the better number for judging a method after the fact.
Should fees be included in the risk-reward ratio?
Yes. Commission and slippage make each loss bigger and each win smaller, so the real ratio is always a bit worse than the one drawn on the chart, and much worse when the stop is tight.
The bottom line
The risk-reward ratio is half of an equation. The other half is how often your trades win, and you only learn that from a record. Plan the stop where the idea fails, aim for a target the chart supports, include fees, and judge the result by expectancy or profit factor, not by the ratio alone. To see how a fixed stop, two targets and a 2% risk per trade play out over years of data, every trade is on the Price Action results page, and our study of wedge, triangle and channel breakouts shows the same lesson pattern by pattern: a 64% win rate that still lost money.