Invite-only · Tested coin by coin

Crypto strategies for TradingView

Price Action trades confirmed wedge, triangle and channel breakouts. Smart DCA scales into Bitcoin and large caps on a ladder that adapts to volatility. Full TradingView reports and every coin we tested are published, losers included.Price Action trades confirmed breakouts. Smart DCA scales into Bitcoin and large caps. Every test published, losers included.

From $39/month · Cancel anytime · No exchange keys

Highlights

What the backtests show

Every coin and timeframe we tested, at the same default settings, losers included. Four highlights first, each with its scope and source.Every coin and timeframe we tested, at the same default settings, losers included.

Price Action120 tests: 40 coins × 1h, 2h, 4h

  • SOL 2h: +94.4% net, max drawdown 8.0%, profit factor 2.75, from Sep 2020
  • BNB 2h: +60.1% net, max drawdown 7.9%, profit factor 1.93, from Feb 2020
  • XLM 1h: +57.9% net, max drawdown 16.1%, profit factor 2.02, from Jan 2020
  • DOT 2h: +56.6% net, max drawdown 14.4%, profit factor 1.94, from Aug 2020
  • BTC 4h: +55.1% net, max drawdown 5.5%, profit factor 2.46, from Sep 2019 (simulated; the published chart's coin and timeframe, whose TradingView figures differ slightly)
  • SOL 4h: +52.1% net, max drawdown 6.4%, profit factor 2.18, from Sep 2020
  • LINK 2h: +50.8% net, max drawdown 10.4%, profit factor 1.99, from Jan 2020
  • SOL 1h: +47.9% net, max drawdown 14.6%, profit factor 1.94, from Sep 2020
  • ALGO 1h: +47.8% net, max drawdown 7.3%, profit factor 2.27, from Jun 2020
  • LINK 1h: +43.7% net, max drawdown 8.0%, profit factor 1.77, from Jan 2020
  • DOT 4h: +43.2% net, max drawdown 9.7%, profit factor 2.1, from Aug 2020
  • XRP 1h: +43.0% net, max drawdown 5.9%, profit factor 2.34, from Jan 2020
  • FIL 4h: +42.4% net, max drawdown 5.6%, profit factor 2.23, from Oct 2020
  • BNB 1h: +42.0% net, max drawdown 12.0%, profit factor 1.96, from Feb 2020
  • PEPE 4h: +37.9% net, max drawdown 4.1%, profit factor 3.14, from May 2023
  • LTC 1h: +36.4% net, max drawdown 16.7%, profit factor 1.56, from Jan 2020
  • BNB 4h: +32.5% net, max drawdown 15.8%, profit factor 1.56, from Feb 2020
  • DOGE 4h: +32.5% net, max drawdown 7.5%, profit factor 1.99, from Jul 2020
  • PEPE 2h: +31.7% net, max drawdown 7.9%, profit factor 2, from May 2023
  • INJ 4h: +31.5% net, max drawdown 4.0%, profit factor 3.26, from Aug 2022
  • ATOM 1h: +31.1% net, max drawdown 9.2%, profit factor 1.76, from Feb 2020
  • UNI 1h: +30.8% net, max drawdown 6.0%, profit factor 1.87, from Sep 2020
  • FIL 1h: +29.7% net, max drawdown 7.0%, profit factor 1.77, from Oct 2020
  • LINK 4h: +29.4% net, max drawdown 8.5%, profit factor 1.95, from Jan 2020
  • SHIB 1h: +27.8% net, max drawdown 7.8%, profit factor 1.77, from May 2021
  • DOT 1h: +26.4% net, max drawdown 6.7%, profit factor 1.7, from Aug 2020
  • ADA 4h: +25.2% net, max drawdown 4.1%, profit factor 1.71, from Jan 2020
  • AVAX 4h: +24.2% net, max drawdown 7.5%, profit factor 2.02, from Sep 2020
  • FIL 2h: +23.7% net, max drawdown 11.6%, profit factor 1.65, from Oct 2020
  • ALGO 4h: +23.1% net, max drawdown 9.2%, profit factor 1.73, from Jun 2020
  • DOGE 2h: +23.0% net, max drawdown 17.6%, profit factor 1.57, from Jul 2020
  • ICP 1h: +22.9% net, max drawdown 6.5%, profit factor 1.77, from Sep 2022
  • ATOM 2h: +21.5% net, max drawdown 6.7%, profit factor 1.54, from Feb 2020
  • ZEC 4h: +21.4% net, max drawdown 13.4%, profit factor 1.46, from Feb 2020
  • XRP 2h: +20.2% net, max drawdown 11.6%, profit factor 1.43, from Jan 2020
  • PEPE 1h: +19.4% net, max drawdown 13.9%, profit factor 1.53, from May 2023
  • TAO 2h: +19.2% net, max drawdown 10.3%, profit factor 1.82, from Apr 2024
  • XRP 4h: +19.1% net, max drawdown 6.4%, profit factor 1.53, from Jan 2020
  • ETC 4h: +19.1% net, max drawdown 8.6%, profit factor 1.45, from Jan 2020
  • NEAR 2h: +19.0% net, max drawdown 9.1%, profit factor 1.48, from Oct 2020
  • ADA 2h: +18.6% net, max drawdown 11.6%, profit factor 1.4, from Jan 2020
  • BCH 2h: +18.4% net, max drawdown 14.2%, profit factor 1.34, from Dec 2019
  • AVAX 1h: +17.7% net, max drawdown 13.3%, profit factor 1.5, from Sep 2020
  • SHIB 4h: +17.4% net, max drawdown 4.8%, profit factor 1.74, from May 2021
  • WLD 2h: +17.4% net, max drawdown 5.5%, profit factor 1.98, from Jul 2023
  • ETH 2h: +17.1% net, max drawdown 14.4%, profit factor 1.28, from Nov 2019
  • TRX 4h: +17.1% net, max drawdown 9.2%, profit factor 1.32, from Jan 2020
  • SUI 4h: +15.3% net, max drawdown 8.4%, profit factor 1.77, from May 2023
  • NEAR 1h: +15.2% net, max drawdown 10.7%, profit factor 1.4, from Oct 2020
  • SHIB 2h: +13.6% net, max drawdown 15.8%, profit factor 1.34, from May 2021
  • ALGO 2h: +12.9% net, max drawdown 9.2%, profit factor 1.39, from Jun 2020
  • RENDER 4h: +12.8% net, max drawdown 5.6%, profit factor 1.96, from Jul 2024
  • ETHFI 1h: +12.3% net, max drawdown 8.5%, profit factor 1.81, from Mar 2024
  • ZEC 2h: +12.0% net, max drawdown 14.8%, profit factor 1.21, from Feb 2020
  • TRX 2h: +11.6% net, max drawdown 22.1%, profit factor 1.17, from Jan 2020
  • TAO 1h: +11.6% net, max drawdown 7.5%, profit factor 1.66, from Apr 2024
  • DOGE 1h: +11.5% net, max drawdown 19.4%, profit factor 1.35, from Jul 2020
  • ZRO 4h: +11.4% net, max drawdown 5.7%, profit factor 1.85, from Jun 2024
  • INJ 1h: +11.1% net, max drawdown 5.8%, profit factor 1.42, from Aug 2022
  • UNI 4h: +10.9% net, max drawdown 10.9%, profit factor 1.33, from Sep 2020
  • AAVE 4h: +10.7% net, max drawdown 6.1%, profit factor 1.3, from Oct 2020
  • BTC 1h: +10.6% net, max drawdown 5.3%, profit factor 1.4, from Sep 2019
  • POL 2h: +10.4% net, max drawdown 10.1%, profit factor 1.58, from Sep 2024
  • DASH 1h: +10.2% net, max drawdown 7.8%, profit factor 1.21, from Feb 2020
  • AVAX 2h: +9.9% net, max drawdown 12.1%, profit factor 1.2, from Sep 2020
  • ZRO 2h: +9.8% net, max drawdown 6.6%, profit factor 1.51, from Jun 2024
  • ETHFI 2h: +9.7% net, max drawdown 8.4%, profit factor 1.64, from Mar 2024
  • SUI 2h: +9.2% net, max drawdown 6.3%, profit factor 1.53, from May 2023
  • TRX 1h: +8.7% net, max drawdown 13.3%, profit factor 1.17, from Jan 2020
  • LTC 2h: +8.6% net, max drawdown 22.6%, profit factor 1.14, from Jan 2020
  • RENDER 2h: +8.6% net, max drawdown 4.6%, profit factor 1.33, from Jul 2024
  • ADA 1h: +8.1% net, max drawdown 9.2%, profit factor 1.2, from Jan 2020
  • CAKE 1h: +8.0% net, max drawdown 8.7%, profit factor 1.33, from Nov 2023
  • ETHFI 4h: +7.5% net, max drawdown 6.4%, profit factor 1.45, from Mar 2024
  • BCH 1h: +7.4% net, max drawdown 7.4%, profit factor 1.16, from Dec 2019
  • ENA 4h: +7.2% net, max drawdown 8.8%, profit factor 1.56, from Apr 2024
  • WLD 1h: +7.1% net, max drawdown 9.3%, profit factor 1.34, from Jul 2023
  • QNT 4h: +7.0% net, max drawdown 7.6%, profit factor 1.28, from Oct 2022
  • ENA 1h: +6.9% net, max drawdown 11.3%, profit factor 1.42, from Apr 2024
  • UNI 2h: +5.6% net, max drawdown 6.3%, profit factor 1.15, from Sep 2020
  • RENDER 1h: +5.0% net, max drawdown 6.0%, profit factor 1.27, from Jul 2024
  • NEAR 4h: +4.9% net, max drawdown 11.2%, profit factor 1.13, from Oct 2020
  • XLM 2h: +3.9% net, max drawdown 9.9%, profit factor 1.09, from Jan 2020
  • ICP 2h: +3.5% net, max drawdown 12.2%, profit factor 1.1, from Sep 2022
  • ZRO 1h: +3.5% net, max drawdown 7.0%, profit factor 1.19, from Jun 2024
  • POL 4h: +3.5% net, max drawdown 10.0%, profit factor 1.17, from Sep 2024
  • ARB 4h: +3.5% net, max drawdown 8.6%, profit factor 1.11, from Mar 2023
  • WLD 4h: +2.4% net, max drawdown 4.0%, profit factor 1.23, from Jul 2023
  • SUI 1h: +2.2% net, max drawdown 7.7%, profit factor 1.11, from May 2023
  • POL 1h: +1.9% net, max drawdown 7.2%, profit factor 1.12, from Sep 2024
  • ETC 2h: +1.7% net, max drawdown 9.9%, profit factor 1.03, from Jan 2020
  • AAVE 1h: +1.6% net, max drawdown 16.4%, profit factor 1.03, from Oct 2020
  • ICP 4h: +0.55% net, max drawdown 9.4%, profit factor 1.02, from Sep 2022
  • TAO 4h: +0.14% net, max drawdown 10.0%, profit factor 1.01, from Apr 2024
  • JUP 1h: -0.67% net, max drawdown 4.9%, profit factor 0.96, from Jan 2024
  • ARB 2h: -1.1% net, max drawdown 7.8%, profit factor 0.97, from Mar 2023
  • JUP 2h: -1.2% net, max drawdown 6.7%, profit factor 0.93, from Jan 2024
  • BCH 4h: -1.5% net, max drawdown 17.2%, profit factor 0.97, from Dec 2019
  • ZEC 1h: -1.9% net, max drawdown 14.1%, profit factor 0.96, from Feb 2020
  • QNT 1h: -2.0% net, max drawdown 13.8%, profit factor 0.95, from Oct 2022
  • ETH 4h: -2.5% net, max drawdown 18.4%, profit factor 0.96, from Nov 2019
  • LTC 4h: -2.8% net, max drawdown 13.1%, profit factor 0.93, from Jan 2020
  • ARB 1h: -3.3% net, max drawdown 8.6%, profit factor 0.89, from Mar 2023
  • INJ 2h: -4.3% net, max drawdown 7.6%, profit factor 0.88, from Aug 2022
  • ATOM 4h: -4.8% net, max drawdown 19.4%, profit factor 0.88, from Feb 2020
  • AAVE 2h: -5.2% net, max drawdown 16.2%, profit factor 0.9, from Oct 2020
  • BTC 2h: -6.9% net, max drawdown 16.9%, profit factor 0.89, from Sep 2019
  • ETH 1h: -7.0% net, max drawdown 27.8%, profit factor 0.87, from Nov 2019
  • JUP 4h: -7.3% net, max drawdown 8.0%, profit factor 0.54, from Jan 2024
  • HBAR 1h: -7.6% net, max drawdown 18.3%, profit factor 0.78, from Mar 2021
  • DASH 2h: -7.8% net, max drawdown 10.3%, profit factor 0.88, from Feb 2020
  • ENA 2h: -8.0% net, max drawdown 11.2%, profit factor 0.56, from Apr 2024
  • QNT 2h: -9.8% net, max drawdown 14.1%, profit factor 0.77, from Oct 2022
  • ETC 1h: -9.8% net, max drawdown 15.8%, profit factor 0.79, from Jan 2020
  • CAKE 2h: -10.6% net, max drawdown 17.0%, profit factor 0.67, from Nov 2023
  • HBAR 4h: -11.0% net, max drawdown 21.9%, profit factor 0.75, from Mar 2021
  • CAKE 4h: -11.8% net, max drawdown 12.5%, profit factor 0.46, from Nov 2023
  • XLM 4h: -15.1% net, max drawdown 24.4%, profit factor 0.61, from Jan 2020
  • DASH 4h: -15.6% net, max drawdown 18.6%, profit factor 0.69, from Feb 2020
  • HBAR 2h: -22.3% net, max drawdown 28.4%, profit factor 0.5, from Mar 2021
94 of 120 tests made money: every coin and timeframe at the default settings, net profit, best first. Grey = within 1% of flat, red = lost money.Full table

Smart DCA120 tests: 40 coins × 1h, 2h, 4h

  • ETHFI 4h: +20.5% a year (total +63%), max drawdown 9.6%, from Mar 2024
  • SUI 1h: +19.1% a year (total +84%), max drawdown 24.8%, from May 2023
  • LINK 1h: +18.2% a year (total +266%), max drawdown 22.9%, from Jan 2019
  • SUI 4h: +17.4% a year (total +75%), max drawdown 8.4%, from May 2023
  • DOGE 1h: +16.8% a year (total +211%), max drawdown 30.6%, from Jul 2019
  • LINK 2h: +16.7% a year (total +231%), max drawdown 22.7%, from Jan 2019
  • ZEC 1h: +16.3% a year (total +216%), max drawdown 41.6%, from Mar 2019
  • DOGE 2h: +16.0% a year (total +196%), max drawdown 27.0%, from Jul 2019
  • ADA 2h: +15.4% a year (total +239%), max drawdown 28.7%, from Apr 2018
  • LINK 4h: +15.2% a year (total +200%), max drawdown 16.8%, from Jan 2019
  • ETHFI 1h: +15.2% a year (total +45%), max drawdown 24.8%, from Mar 2024
  • PEPE 1h: +15.1% a year (total +63%), max drawdown 20.0%, from May 2023
  • SUI 2h: +14.8% a year (total +62%), max drawdown 24.3%, from May 2023
  • ZEC 2h: +14.6% a year (total +182%), max drawdown 41.3%, from Mar 2019
  • ADA 1h: +14.4% a year (total +215%), max drawdown 28.6%, from Apr 2018
  • ETHFI 2h: +14.4% a year (total +42%), max drawdown 24.0%, from Mar 2024
  • HBAR 2h: +14.1% a year (total +154%), max drawdown 21.6%, from Sep 2019
  • DOGE 4h: +14.0% a year (total +160%), max drawdown 27.0%, from Jul 2019
  • ENA 1h: +13.7% a year (total +39%), max drawdown 20.6%, from Apr 2024
  • BNB 1h: +13.1% a year (total +195%), max drawdown 22.8%, from Jan 2018
  • SOL 1h: +13.1% a year (total +115%), max drawdown 21.2%, from Aug 2020
  • ADA 4h: +13.0% a year (total +184%), max drawdown 29.1%, from Apr 2018
  • HBAR 1h: +12.9% a year (total +136%), max drawdown 21.5%, from Sep 2019
  • XRP 1h: +12.7% a year (total +176%), max drawdown 19.6%, from May 2018
  • ZEC 4h: +12.7% a year (total +148%), max drawdown 40.6%, from Mar 2019
  • BNB 2h: +12.4% a year (total +179%), max drawdown 22.8%, from Jan 2018
  • NEAR 2h: +12.2% a year (total +100%), max drawdown 37.5%, from Oct 2020
  • HBAR 4h: +12.2% a year (total +126%), max drawdown 21.4%, from Sep 2019
  • ENA 4h: +12.1% a year (total +34%), max drawdown 20.3%, from Apr 2024
  • XRP 2h: +12.0% a year (total +161%), max drawdown 16.0%, from May 2018
  • BNB 4h: +11.6% a year (total +164%), max drawdown 23.6%, from Jan 2018
  • TRX 1h: +11.6% a year (total +150%), max drawdown 34.8%, from Jun 2018
  • NEAR 1h: +11.5% a year (total +93%), max drawdown 43.5%, from Oct 2020
  • SOL 2h: +11.3% a year (total +95%), max drawdown 18.7%, from Aug 2020
  • TRX 2h: +11.3% a year (total +145%), max drawdown 23.0%, from Jun 2018
  • ENA 2h: +11.3% a year (total +32%), max drawdown 20.4%, from Apr 2024
  • TRX 4h: +11.0% a year (total +139%), max drawdown 21.7%, from Jun 2018
  • SOL 4h: +10.9% a year (total +90%), max drawdown 18.6%, from Aug 2020
  • DASH 1h: +10.7% a year (total +116%), max drawdown 36.5%, from Mar 2019
  • DASH 4h: +10.6% a year (total +115%), max drawdown 22.1%, from Mar 2019
  • XRP 4h: +10.3% a year (total +129%), max drawdown 19.2%, from May 2018
  • ETH 1h: +10.2% a year (total +136%), max drawdown 24.6%, from Jan 2018
  • NEAR 4h: +10.1% a year (total +79%), max drawdown 37.6%, from Oct 2020
  • AVAX 1h: +10.1% a year (total +80%), max drawdown 22.4%, from Sep 2020
  • ETH 2h: +9.8% a year (total +128%), max drawdown 25.1%, from Jan 2018
  • BTC 1h: +9.7% a year (total +126%), max drawdown 17.5%, from Jan 2018
  • AVAX 4h: +9.6% a year (total +75%), max drawdown 21.1%, from Sep 2020
  • TAO 1h: +9.6% a year (total +26%), max drawdown 12.6%, from Apr 2024
  • BTC 2h: +9.3% a year (total +120%), max drawdown 17.1%, from Jan 2018
  • ETH 4h: +9.3% a year (total +119%), max drawdown 22.2%, from Jan 2018
  • LTC 1h: +9.3% a year (total +120%), max drawdown 35.4%, from Jan 2018
  • UNI 1h: +9.2% a year (total +71%), max drawdown 25.8%, from Sep 2020
  • BTC 4h: +9.0% a year (total +113%), max drawdown 17.2%, from Jan 2018 (simulated; the published chart's coin and timeframe, whose TradingView figures differ slightly)
  • AVAX 2h: +8.9% a year (total +68%), max drawdown 21.8%, from Sep 2020
  • XLM 2h: +8.7% a year (total +102%), max drawdown 30.9%, from May 2018
  • UNI 2h: +8.6% a year (total +65%), max drawdown 20.6%, from Sep 2020
  • BCH 1h: +8.2% a year (total +73%), max drawdown 36.0%, from Nov 2019
  • LTC 2h: +8.2% a year (total +100%), max drawdown 35.1%, from Jan 2018
  • BCH 2h: +8.0% a year (total +71%), max drawdown 36.0%, from Nov 2019
  • ALGO 1h: +7.9% a year (total +74%), max drawdown 33.7%, from Jun 2019
  • XLM 4h: +7.8% a year (total +88%), max drawdown 25.6%, from May 2018
  • AAVE 2h: +7.7% a year (total +57%), max drawdown 19.6%, from Oct 2020
  • TAO 4h: +7.6% a year (total +21%), max drawdown 12.5%, from Apr 2024
  • UNI 4h: +7.3% a year (total +54%), max drawdown 21.4%, from Sep 2020
  • LTC 4h: +7.2% a year (total +84%), max drawdown 34.5%, from Jan 2018
  • ALGO 4h: +7.1% a year (total +65%), max drawdown 24.3%, from Jun 2019
  • ETC 1h: +6.9% a year (total +74%), max drawdown 31.6%, from Jun 2018
  • BCH 4h: +6.8% a year (total +58%), max drawdown 35.3%, from Nov 2019
  • ETC 2h: +6.6% a year (total +71%), max drawdown 32.2%, from Jun 2018
  • CAKE 4h: +6.6% a year (total +44%), max drawdown 62.2%, from Feb 2021
  • QNT 1h: +6.2% a year (total +37%), max drawdown 20.9%, from Jul 2021
  • ETC 4h: +5.6% a year (total +58%), max drawdown 31.5%, from Jun 2018
  • ALGO 2h: +5.6% a year (total +49%), max drawdown 32.7%, from Jun 2019
  • QNT 2h: +4.9% a year (total +28%), max drawdown 21.1%, from Jul 2021
  • TAO 2h: +4.8% a year (total +13%), max drawdown 12.5%, from Apr 2024
  • AAVE 1h: +4.8% a year (total +33%), max drawdown 51.2%, from Oct 2020
  • XLM 1h: +4.5% a year (total +45%), max drawdown 31.0%, from May 2018
  • PEPE 2h: +4.1% a year (total +15%), max drawdown 32.0%, from May 2023
  • INJ 1h: +3.7% a year (total +24%), max drawdown 44.2%, from Oct 2020
  • ATOM 4h: +3.6% a year (total +31%), max drawdown 34.2%, from Apr 2019
  • AAVE 4h: +3.4% a year (total +22%), max drawdown 31.6%, from Oct 2020
  • QNT 4h: +3.2% a year (total +18%), max drawdown 18.9%, from Jul 2021
  • PEPE 4h: +3.1% a year (total +11%), max drawdown 32.4%, from May 2023
  • ICP 2h: +2.8% a year (total +16%), max drawdown 27.9%, from May 2021
  • ICP 1h: +2.8% a year (total +16%), max drawdown 28.1%, from May 2021
  • WLD 1h: +2.2% a year (total +7%), max drawdown 20.5%, from Jul 2023
  • INJ 2h: +2.2% a year (total +14%), max drawdown 43.4%, from Oct 2020
  • ATOM 2h: +2.0% a year (total +16%), max drawdown 45.8%, from Apr 2019
  • ATOM 1h: +1.9% a year (total +15%), max drawdown 46.0%, from Apr 2019
  • POL 2h: +1.8% a year (total +4%), max drawdown 8.7%, from Sep 2024
  • POL 4h: +1.7% a year (total +4%), max drawdown 8.8%, from Sep 2024
  • INJ 4h: +1.6% a year (total +10%), max drawdown 43.3%, from Oct 2020
  • ZRO 1h: +1.4% a year (total +3%), max drawdown 27.1%, from Jun 2024
  • POL 1h: +1.1% a year (total +2%), max drawdown 10.1%, from Sep 2024
  • ICP 4h: +0.8% a year (total +4%), max drawdown 28.0%, from May 2021
  • DASH 2h: -2.0% a year (total -14%), max drawdown 46.1%, from Mar 2019
  • DOT 1h: -2.4% a year (total -14%), max drawdown 29.6%, from Aug 2020
  • SHIB 2h: -2.6% a year (total -14%), max drawdown 31.6%, from May 2021
  • SHIB 1h: -2.6% a year (total -14%), max drawdown 31.6%, from May 2021
  • DOT 4h: -3.0% a year (total -17%), max drawdown 29.6%, from Aug 2020
  • DOT 2h: -4.1% a year (total -23%), max drawdown 37.6%, from Aug 2020
  • ARB 2h: -4.9% a year (total -17%), max drawdown 42.9%, from Mar 2023
  • SHIB 4h: -5.2% a year (total -25%), max drawdown 38.9%, from May 2021
  • ARB 1h: -5.3% a year (total -18%), max drawdown 43.4%, from Mar 2023
  • JUP 4h: -5.5% a year (total -14%), max drawdown 29.6%, from Jan 2024
  • JUP 1h: -5.5% a year (total -14%), max drawdown 29.9%, from Jan 2024
  • JUP 2h: -5.9% a year (total -15%), max drawdown 30.1%, from Jan 2024
  • ARB 4h: -6.2% a year (total -21%), max drawdown 42.8%, from Mar 2023
  • CAKE 2h: -8.2% a year (total -39%), max drawdown 50.7%, from Feb 2021
  • CAKE 1h: -8.2% a year (total -39%), max drawdown 50.7%, from Feb 2021
  • RENDER 4h: -8.4% a year (total -18%), max drawdown 30.9%, from Jul 2024
  • RENDER 2h: -8.4% a year (total -18%), max drawdown 31.2%, from Jul 2024
  • RENDER 1h: -8.5% a year (total -18%), max drawdown 31.3%, from Jul 2024
  • WLD 2h: -9.2% a year (total -27%), max drawdown 42.8%, from Jul 2023
  • ZRO 4h: -9.3% a year (total -21%), max drawdown 36.5%, from Jun 2024
  • ZRO 2h: -9.4% a year (total -21%), max drawdown 36.5%, from Jun 2024
  • WLD 4h: -9.6% a year (total -28%), max drawdown 42.9%, from Jul 2023
  • FIL 2h: -19.5% a year (total -73%), max drawdown 75.7%, from Oct 2020
  • FIL 4h: -19.6% a year (total -73%), max drawdown 75.6%, from Oct 2020
  • FIL 1h: -20.1% a year (total -74%), max drawdown 76.4%, from Oct 2020
95 of 120 tests ended above their start: every coin and timeframe at the default settings, yearly return, best first. Grey = within 1% a year of flat, red = lost money.Full table

Multi-coin tiles: Navixa's research simulator, the same settings on every coin. Backtest, simulated, not live trading. Past results do not guarantee future results.

Price Action

Confirmed breakouts, planned before entry

  • Confirmed, never repainted

    A pattern is drawn only after its last turning point is confirmed, and it never moves afterwards. Breakouts are judged on candle closes only.

    So the history is a fair test: every trade on it is one the strategy could have taken live, and a signal never disappears after it fires.

    More: Confirmed, never repainted
  • Every trade planned at entry

    Stop, two targets and position size are set at the breakout close and sent with the entry, so the trade is protected from its first candle. Late or low-reward setups are skipped.

    The largest loss on the published chart was 1.0R, the planned risk, fees included.Published TradingView chart, BTCUSDT.P 4h · 1R = the amount risked on one trade (2% of the balance by default) · backtest, not live trading

    More: Every trade planned at entry
  • Bank early, protect the rest

    Part of the position closes at the first target. The stop of the rest then moves just past the entry, so a trade that reached its first target normally cannot turn into a loss (gaps and slippage aside).

    64% of positions on the BTC chart reached the first target (26% both targets, 38% first target then breakeven).Published TradingView chart, BTCUSDT.P 4h · backtest, not live trading

    More: Bank early, protect the rest
  • Reverses when the market flips

    When a confirmed breakout fires the other way, the open trade is closed and reversed instead of waiting for its stop.

    9% of positions on the BTC chart closed by a reversal.Published TradingView chart, BTCUSDT.P 4h · backtest, not live trading

    More: Reverses when the market flips
Smart DCA

An adaptive ladder for Bitcoin and large caps

  • Levels spaced by volatility

    Every cycle plans a fresh ladder of buy levels from the coin's own daily volatility: tight in calm markets, so ordinary dips fill, and wide in wild ones, so one bad day cannot use it all up.

    The ladder table on the published chart lists every level before it fills.Published TradingView chart, BTCUSDT 4h · backtest, not live trading

    More: Levels spaced by volatility
  • Pauses, then resumes lower

    When the daily trend turns down, pending buys pause. When it turns back up, levels the price already passed fill at the lower market price: the same coins for less money.

    On the published chart, cycle 102's planned average was 95,747 and its actual average is 89,099.Published TradingView chart, BTCUSDT 4h · backtest, not live trading

    More: Pauses, then resumes lower
  • Budgeted before the first buy

    The whole ladder is sized to your balance before the first order. A cycle never runs out of money halfway and never borrows, and profits compound into the next cycle.

    Cycle 102 on the published chart has filled 9 of 9 levels, all from the budget set before its first buy.Published TradingView chart, BTCUSDT 4h · backtest, not live trading

    More: Budgeted before the first buy
  • Shows its own risk

    The Cycle Length table shows how long cycles took and, for the longest one, its worst open loss next to the coin's own fall over the same period. Worst open loss and time in market are in the statistics too.

    Longest cycle 612 days, 31% of the account invested on average, worst open loss -17% while Bitcoin fell 77%.Published TradingView chart, BTCUSDT 4h · backtest, not live trading

    More: Shows its own risk
The published charts

Backtests on TradingView

Each strategy's published chart, from TradingView's strategy tester, drawdown and losing trades included.Each strategy's published TradingView chart, drawdown and losing trades included.

Strategy 1 of 2

Price Action: Wedge, Triangle, Channel

Open on TradingViewTradingView

Waits for a wedge, triangle or channel to form and trades the breakout only after a candle closes beyond it. Every trade has its stop, two targets and size set at entry.

Market
Binance BTCUSDT perpetual
Timeframe
4h
Period tested
Oct 2019 → Oct 2026
Costs applied
0.05% commission · 5 ticks slippage · 10,000 USDT start
+56.05%
Total P&L
+5,604.79 USDT
6.03%
Max drawdown
611.12 USDT
71.30%
Profitable trades
82 of 11558 positions
2.491
Profit factor
Long 3.922short 1.554

The published BTC 4h chart (+56.05%) is the best 4h result of our 40 coins (simulated). The 4h median: +10.9% on all 40 coins, +15.3% on the top 20 by market cap.
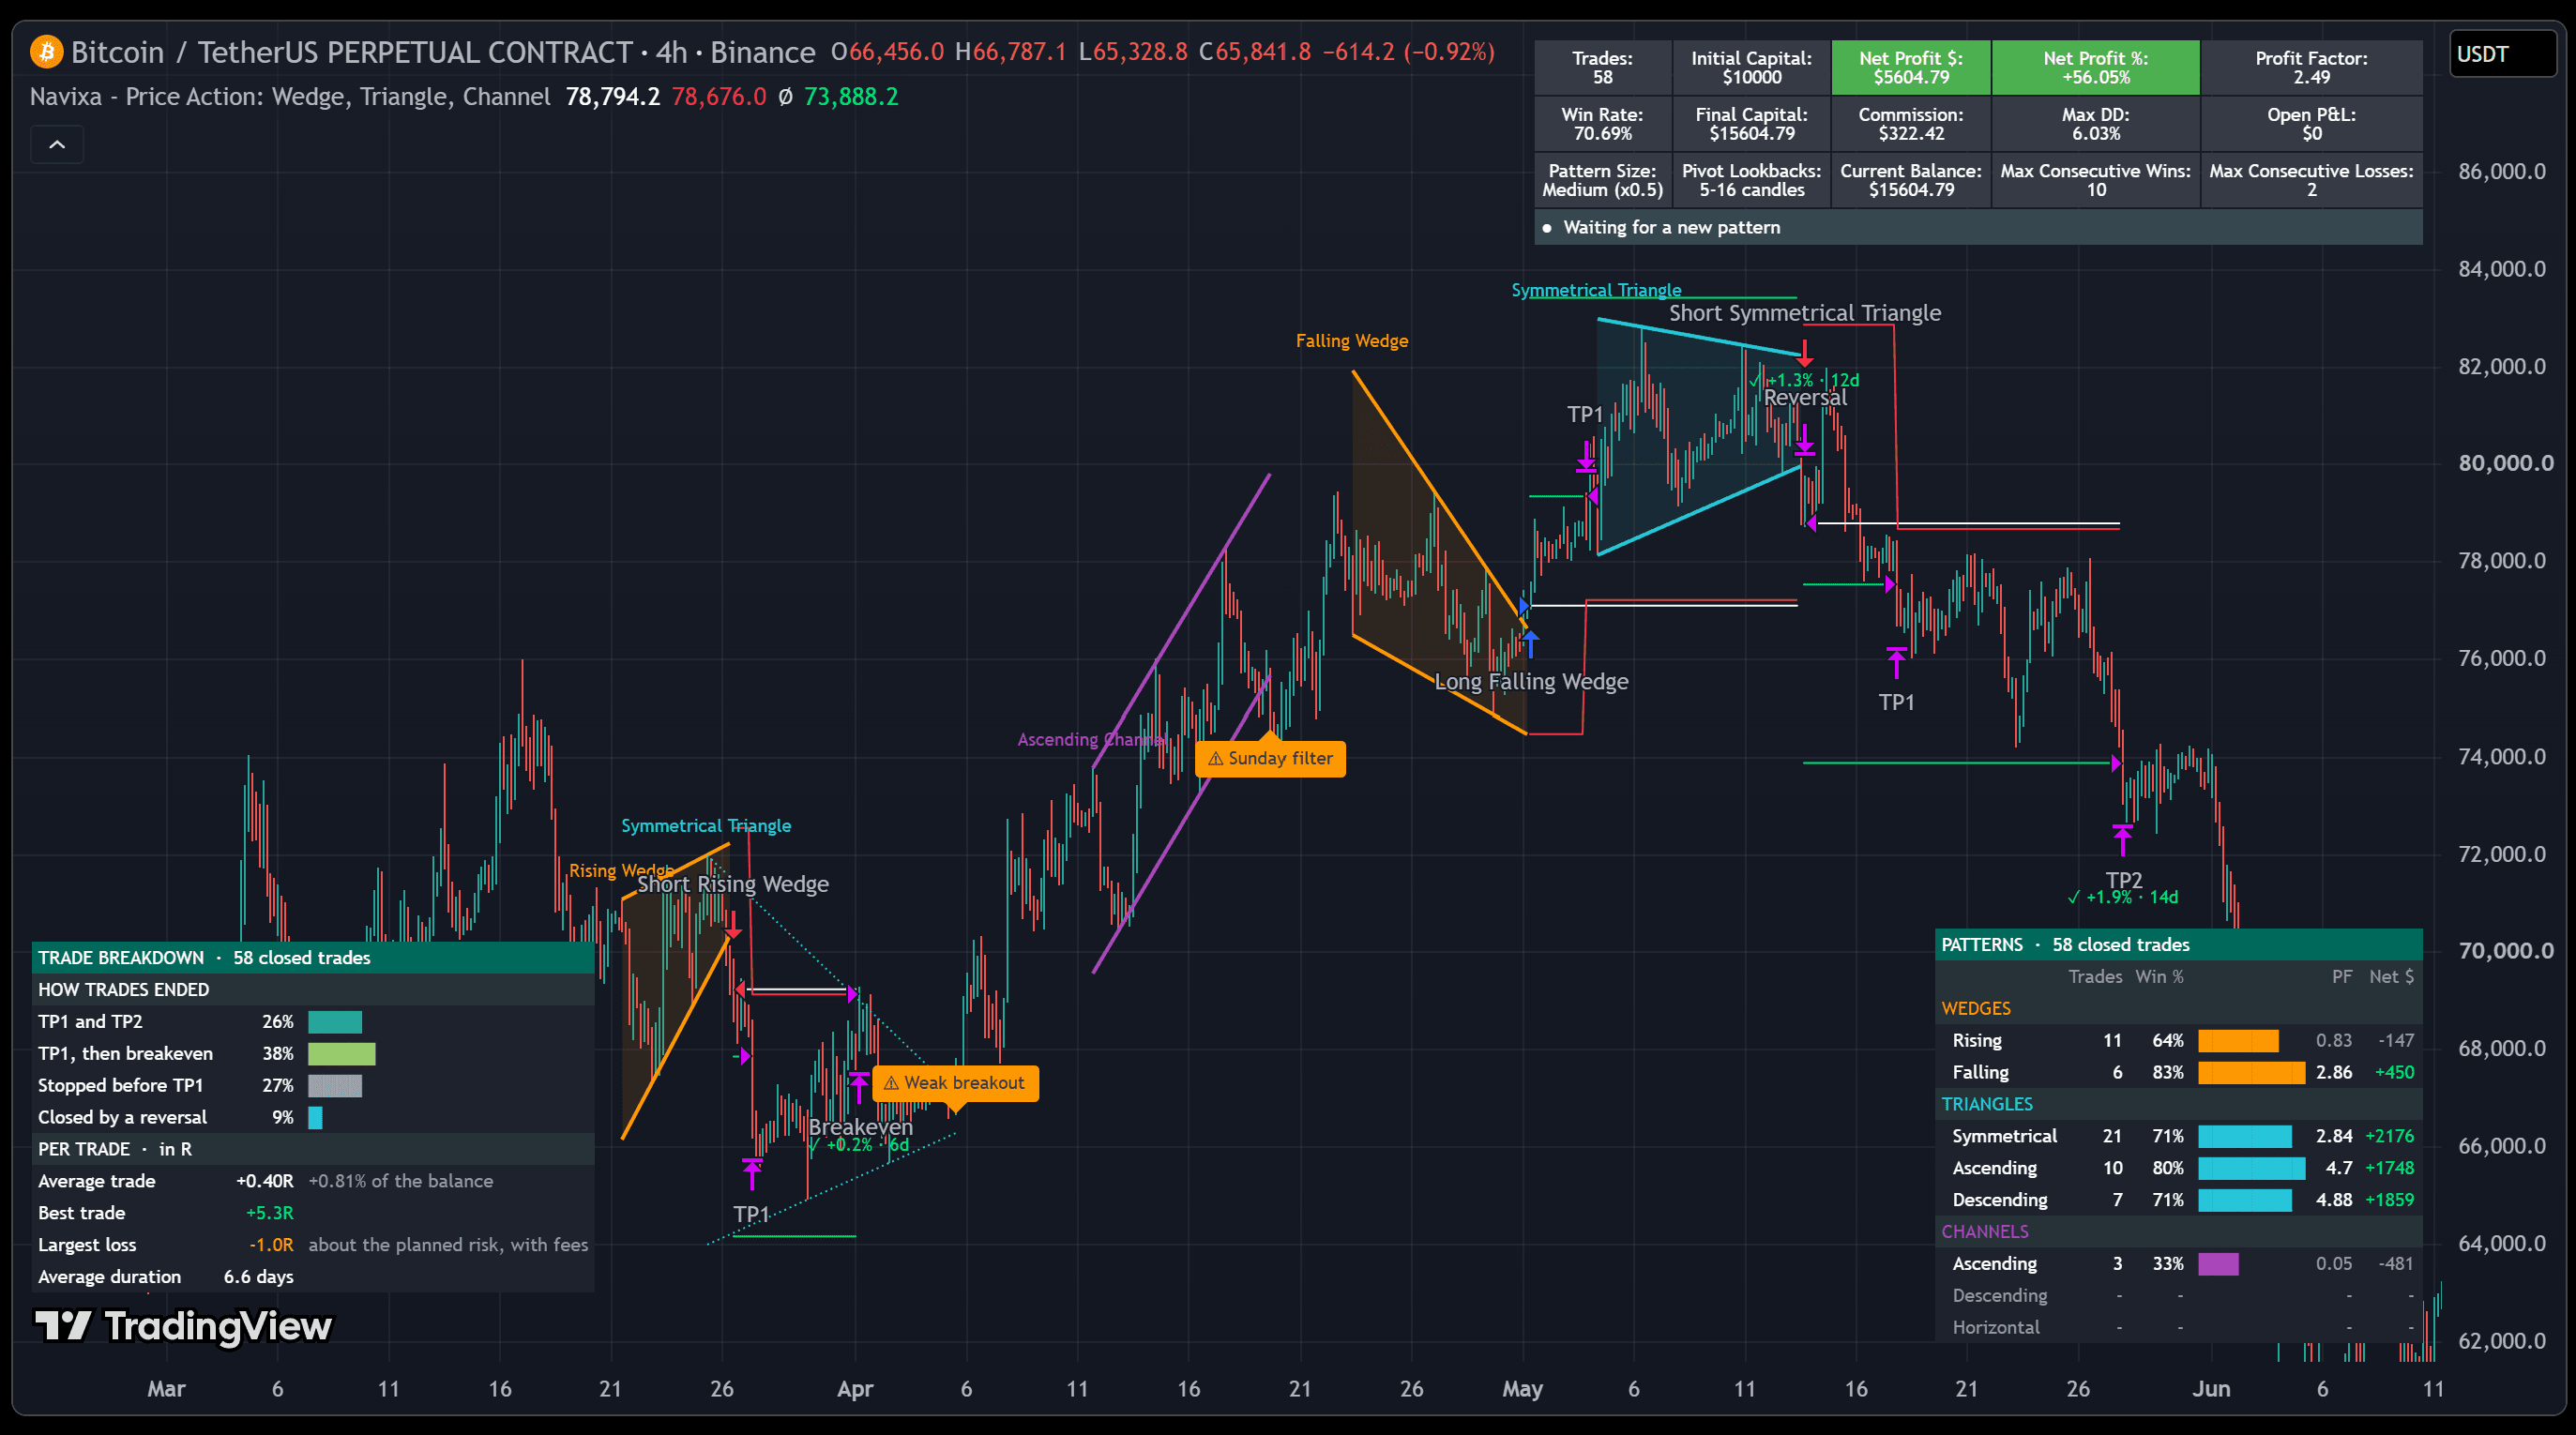
Entries on chart · Price ActionWhere the strategy opened and closed during the test
Navixa Price Action on the Binance BTCUSDT perpetual 4-hour chart: a short rising wedge, a long falling wedge and a symmetrical-triangle reversal, with the backtest table (58 positions, +56.05%, 6.03% max drawdown), trade breakdown and pattern statistics.

Report captured Oct 2026. Simulated results from TradingView's strategy tester, not a record of live trading. Hypothetical performance has inherent limitations and does not guarantee future results.Simulated, not live trading. Past results do not guarantee future results.

Strategy 2 of 2

Smart DCA: Adaptive Trend Continuation

Open on TradingViewTradingView

Builds a Bitcoin or large-cap position in steps, on a ladder that adapts to volatility, only while the daily trend is up. One take profit sells it all; there is no stop loss by default.

Market
Binance BTCUSDT spot
Timeframe
4h
Period tested
Mar 2018 → Oct 2026
Costs applied
0.1% commission · 5 ticks slippage · 10,000 USDT start
+109.91%
Total P&L
Open cycle includedclosed net +119.38%
17.77%
Max drawdown
3,099.97 USDT
80.80%
Profitable trades
181 of 224 orders101 closed cycles
4.441
Profit factor
No stop loss by default
  • Worst open loss -17.73%
  • Time in market 91.8%
  • Longest cycle 612 days

No stop loss by default. In our multi-coin backtests (simulated, 4h), four of the top 20 by market cap still hold a cycle opened more than a year ago: BTC, ETH, BNB and SOL. Across all 40 coins on 4h, 17 of 40 do.
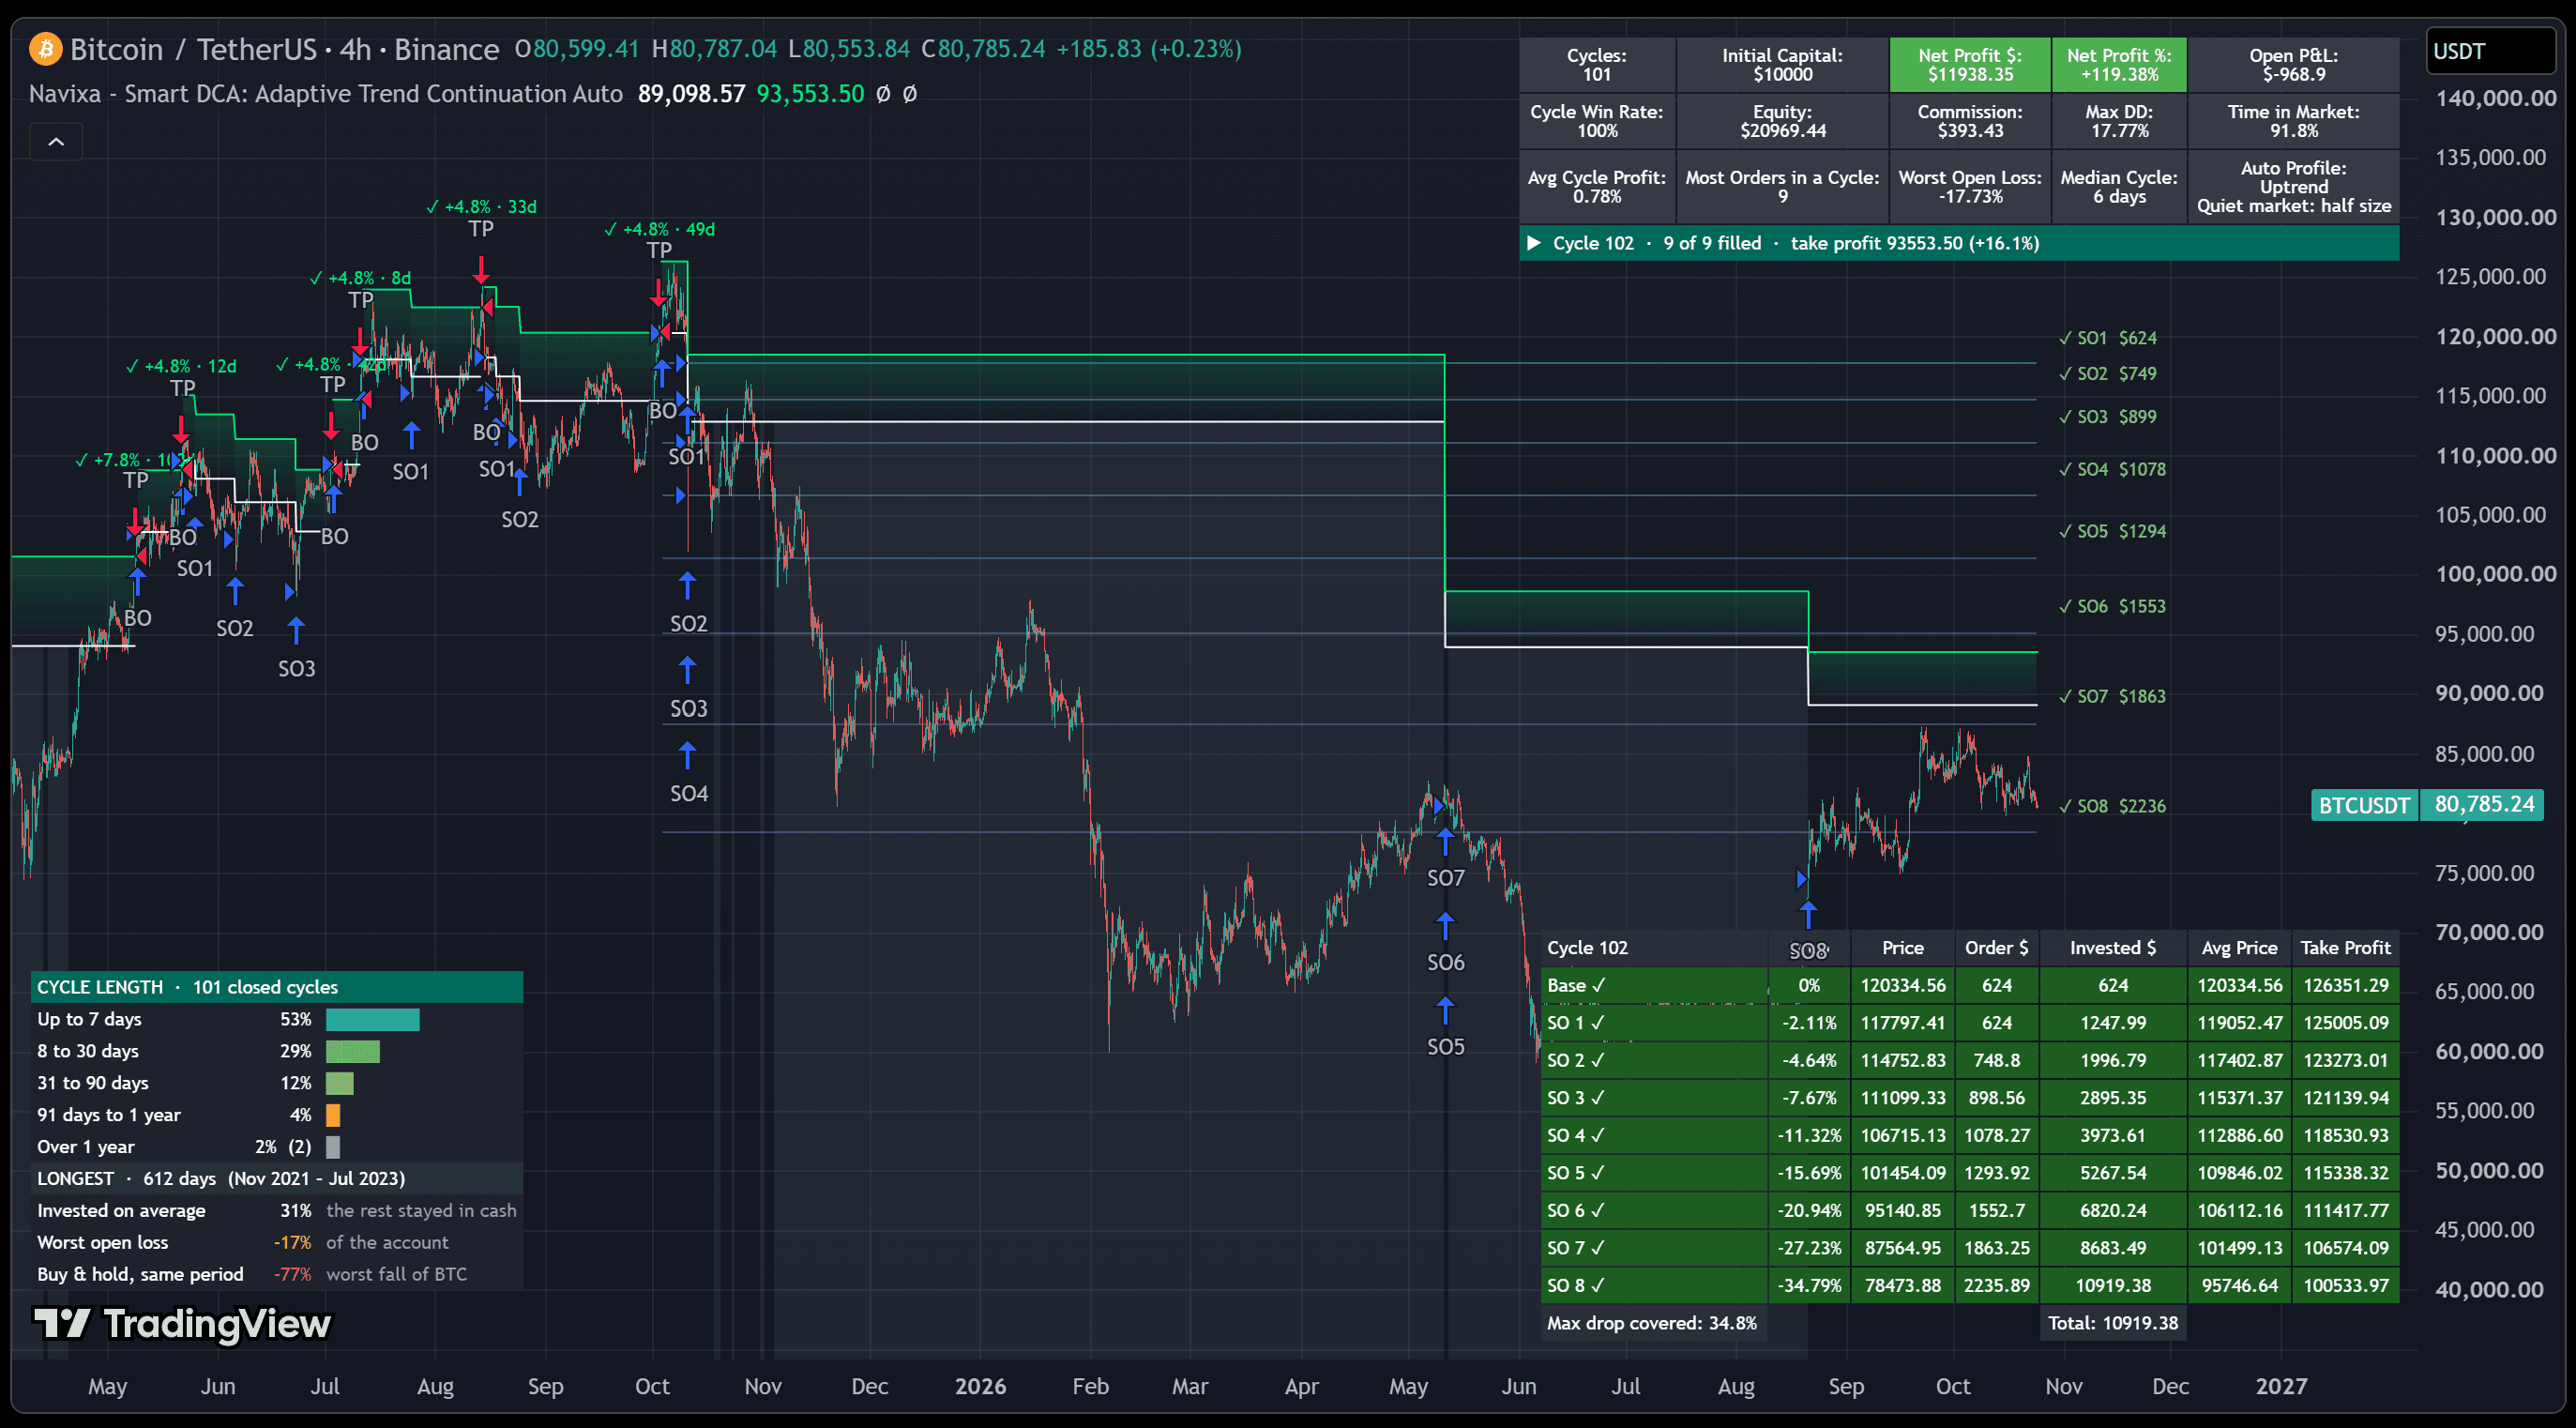
Entries on chart · Smart DCAWhere the strategy opened and closed during the test
Navixa Smart DCA on the Binance BTCUSDT spot 4-hour chart: a cycle with eight filled safety orders, the ladder table, the cycle-length table (101 closed cycles, longest 612 days) and the statistics panel (17.77% max drawdown, 91.8% time in market).

Report captured Oct 2026. Simulated results from TradingView's strategy tester, not a record of live trading. Hypothetical performance has inherent limitations and does not guarantee future results.Simulated, not live trading. Past results do not guarantee future results.

Features

Built into both strategies

No software to install and no exchange keys to hand over: your seat is added to your own TradingView account.No software and no exchange keys: your seat is added to your own TradingView account.

How it works

Up and running within 24 hours

Three steps from checkout to your first signal.

Step 1: Pick a strategy

Compare the strategies and check their results, then choose the plan that fits.

Step 2: Subscribe

Check out securely with Stripe and enter your TradingView username at payment.

Step 3: Get activated

Your invite-only access is activated on your TradingView account within 24 hours.

✓ Invite-only TradingView access
✓ Alerts on every entry and exit
✓ Setup support
✓ Cancel anytime
Pricing

Get your seat on TradingView

A private invite-only seat on your own TradingView account, activated within 24 hours of checkout.A private invite-only seat on your own account, activated within 24 hours.

Navixa provides no financial advice. Trading carries risk and past results do not guarantee future performance.

Frequently asked questions

Experience, markets, automation and capital, in short answers.