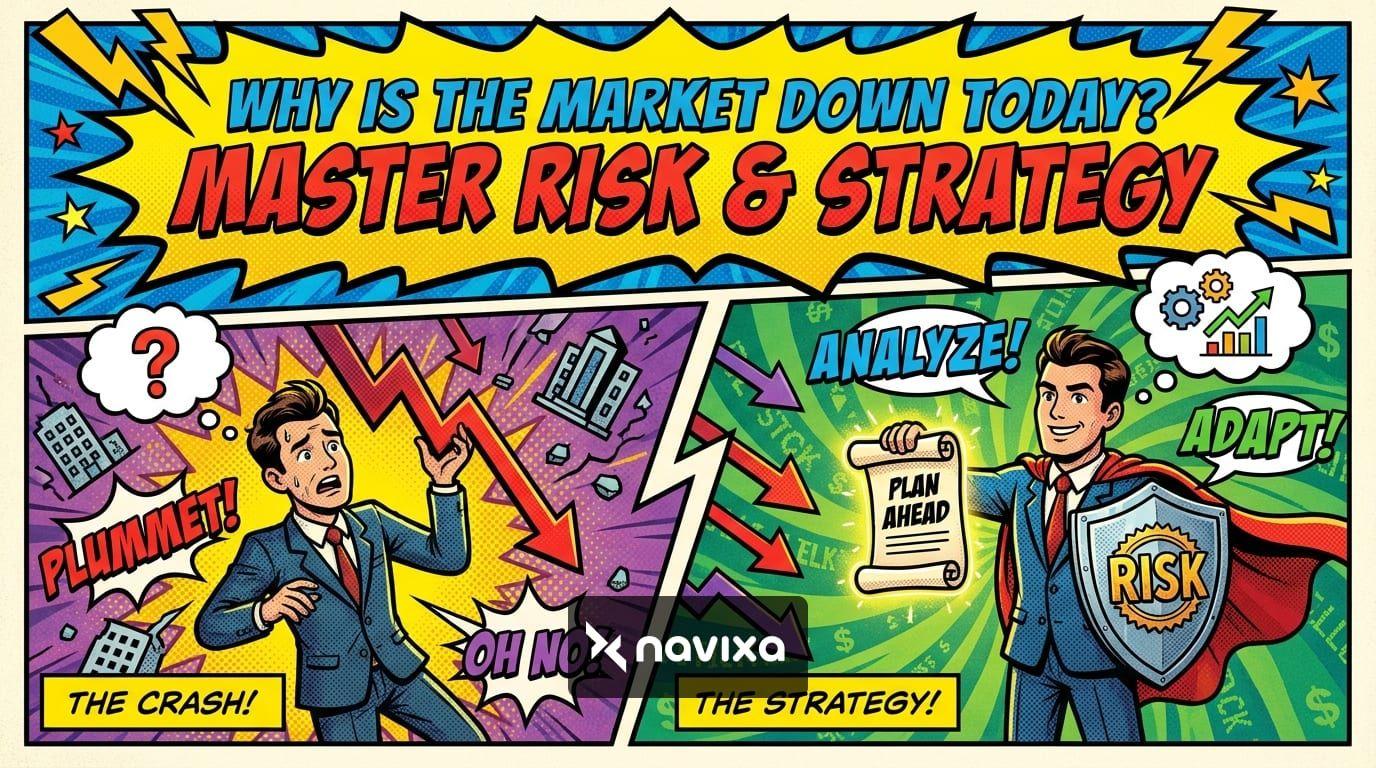
Every active trader and investor eventually wakes up to a sea of red screens, prompting the immediate, anxious question: why is the market down today? Whether you are trading traditional equities, high-beta tech stocks, or volatile cryptocurrencies, sudden market drawdowns can trigger panic. However, seasoned professionals understand that market corrections are a natural part of the financial ecosystem. Instead of reacting emotionally, they rely on objective analysis, robust risk management, and sound trading psychology to navigate the turbulence.
In this comprehensive guide, we will explore the fundamental macroeconomic forces that cause market-wide sell-offs, dissect the psychological challenges traders face during these drawdowns, and provide actionable technical strategies to protect your capital and identify new opportunities.
Core Macro Triggers: Why Is the Market Down Today?
To understand short-term market drops, it is crucial to zoom out and analyze the broader macroeconomic landscape. Markets do not operate in a vacuum; they are constantly pricing in new information, forward-looking expectations, and global geopolitical shifts.
1. Interest Rate Recalibration and Fed Policy
One of the most persistent drivers of market volatility is shifting expectations surrounding central bank monetary policy. When investors anticipate that the Federal Reserve will keep interest rates "higher for longer" to combat sticky inflation, risk assets typically suffer. Higher interest rates increase the cost of borrowing for corporations, squeezing profit margins. Furthermore, elevated yields on risk-free government bonds make volatile assets like stocks and cryptocurrencies comparatively less attractive. Traders closely monitor the CME FedWatch Tool to gauge market probabilities for rate cuts or hikes, as sudden recalibrations in these expectations often trigger immediate sell-offs.
2. Sector Rotation and Tech Volatility
Sometimes, the broader market indices decline because of localized weakness in heavy-weighted sectors. Massive investments in artificial intelligence and software have driven outsized gains in the tech sector over recent years. However, when valuations become overextended, institutional investors often initiate sector rotations—selling high-flying tech stocks and reallocating capital to defensive sectors like utilities or consumer staples. This rotation can drag down the Nasdaq and S&P 500, leading retail traders to wonder why their portfolios are bleeding while the broader economy seems stable.
3. Cryptocurrency Decoupling and ETF Flows
In the digital asset space, Bitcoin and altcoins often act as leading indicators for broader risk sentiment. While institutional adoption has brought billions of dollars in volume, it has also firmly tied cryptocurrency to traditional macro finance. A weekend sink in Bitcoin prices, driven by mixed spot ETF outflows, liquidity sweeps near major resistance levels, or regulatory anxiety, can easily spill over into the equity futures market by Monday morning. Tracking macroeconomic data through platforms like Federal Reserve Economic Data (FRED) helps traders anticipate these complex cross-asset correlations.
4. Geopolitical and Trade Uncertainty
Unexpected geopolitical events—such as sudden global tariff announcements, supply chain disruptions, or international conflicts—inject immediate uncertainty into the market. Markets despise uncertainty. When global trade relations sour, algorithms and institutional money managers de-risk their portfolios, sparking cascading liquidations across global exchanges.
Market Analysis & Trading Psychology
Understanding the fundamental reasons behind a drop is only half the battle. The other half—arguably the more important half—is mastering your own mind. This brings us to a critical pillar of long-term profitability: trading psychology.
When you ask "why is the market down today," the question is often driven by a psychological phenomenon known as loss aversion. Behavioral finance studies show that the psychological pain of losing money is twice as intense as the joy of gaining the same amount. This cognitive bias can cause traders to make irrational decisions during a sell-off, such as panic-selling at the absolute bottom or averaging down into a losing position without a clear structural thesis.
To thrive during market drawdowns, you must cultivate deep emotional discipline:
"The stock market is a device for transferring money from the impatient to the patient."
* Acceptance of Variance: Professional traders accept that losing days are simply the cost of doing business. They do not view a red day as a personal failure but as a statistical probability within their trading system. * Combating Recency Bias: When the market drops sharply, it is easy to believe it will continue falling forever. Zoom out. Look at higher timeframe charts to maintain a rational perspective on long-term macro trends. * Avoiding Revenge Trading: The worst reaction to a sudden market drop is attempting to aggressively win back your losses. Revenge trading usually leads to oversized positions, ignored stop-losses, and entirely blown accounts.
By treating market pullbacks as data rather than threats, you transition from a reactive amateur to a proactive professional.
Technical Analysis: Finding Support in a Sea of Red
When fundamentals fail to calm the market, technical analysis provides the objective framework needed to navigate the storm. Technical indicators help traders identify exactly where the intense selling pressure might exhaust itself.
Identifying Key Support Levels
The first step during a market drop is identifying horizontal support levels and trendlines. Support represents a price zone where historical buying interest has been strong enough to overcome selling pressure. If a major index breaks below a critical psychological level, it often triggers algorithmic stop-losses, accelerating the decline until the next structural support is firmly reached.
Volume Analysis and Moving Averages
A market drop on low volume often indicates a lack of conviction from sellers, suggesting the pullback may be temporary. Conversely, a sharp decline on massive volume signals deep institutional distribution. Traders should also monitor key moving averages, such as the 50-day and 200-day Exponential Moving Averages (EMA). A break below the 200-day EMA is widely regarded as a bearish signal, prompting many quantitative funds to reduce long exposure.
Monitoring Volatility
To gauge the severity of market fear, professionals look to the VIX (Volatility Index) for equities and similar implied volatility metrics for digital assets. A spiking VIX indicates that options traders are aggressively paying up for downside protection. For those trading digital assets, understanding volatility is paramount; you can learn more by exploring our dedicated guide on CBOE Volatility Index: Crypto Trading Strategies.
Developing a Defensive Trading Strategy
Surviving and thriving in a down market requires a rapid shift from offensive profit-seeking to defensive capital preservation. A well-constructed trading strategy acts as a shield against market turbulence.
Whether you are trading large-cap equities or volatile tech sectors, your approach must adapt. For instance, traders utilizing a Proven Dow Jones Trading Strategy & Market Guide know that established blue-chip stocks behave fundamentally differently during a market panic than highly speculative growth assets.
Actionable Steps to Protect Capital
1. Strict Position Sizing: Never risk more than 1-2% of your total account equity on a single trade. In highly volatile conditions, reduce your standard position size to accommodate wider stop-loss placements without increasing your overall dollar risk. 2. Use Trailing Stop-Losses: If you are holding profitable long positions when a sudden drop occurs, a trailing stop-loss helps lock in profits while giving the asset room to breathe if it quickly rebounds. 3. Hedge Your Portfolio: Sophisticated traders use inverse ETFs, put options, or shorting strategies to offset long exposure. Hedging allows you to mitigate downside risk without necessarily liquidating your core, long-term holdings. 4. Hold Cash: Cash is a highly valid position. When market conditions become intensely unpredictable, stepping to the sidelines and preserving capital is often the most profitable decision you can make.
Adapting to Market Conditions: Strategy Comparison
Different market environments demand radically different tactical approaches. The strategies that generate massive returns during a parabolic bull run will rapidly destroy your account during a structural correction. Below is a comparison of how to adapt your methodology based on the prevailing trend.
| Feature | Bull Market Approach | Bear/Correction Market Approach |
|---|---|---|
| Primary Trend Focus | Buying pullbacks (Buy the Dip) | Selling rallies (Short the Bounce) |
| Position Sizing | Full size, compounding aggressive gains | Reduced size, defensive scaling |
| Holding Period | Longer duration, riding macro momentum | Shorter duration, quick tactical profit taking |
| Leverage Usage | Moderate to amplify clear breakout trends | Minimal to zero, avoiding liquidation cascades |
| Key Indicators | RSI (Overbought ignored), MACD crosses | VIX spikes, Volume profile, Support/Resistance retests |
| Psychological Stance | Optimism, maximizing upside potential | Caution, strict capital preservation and patience |
Practical Takeaways for Active Traders
When the market is down today, your very first action should be inaction. Pause, assess the situation, and consult your predetermined trading plan. Here are the core takeaways to remember:
* Context is King: Always determine if the drop is a localized technical correction or a systemic macroeconomic shift driven by interest rates or geopolitical events. * Control the Controllables: You cannot control global tariffs, Federal Reserve announcements, or sudden ETF outflows. You can strictly control your position sizing, your stop-loss placement, and your emotional reactions. * Wait for Confirmation: Do not try to catch a falling knife. Wait for technical confirmation, such as a bullish divergence, a strong reversal candlestick on high volume, or a successful reclaim of a broken support level, before re-entering long positions. * Continuous Education: A down market is the perfect time to refine your skills and study new strategies. For comprehensive insights into navigating the digital asset space, read our Proven Long-Term Cryptocurrency Trading Strategies and dive deep into technical mechanics with our How to Trade BTC Price: A Step-by-Step Guide.
Conclusion
The phrase "the market is down today" should not evoke fear; it should evoke meticulous preparation. Red days are a natural mechanism for markets to clear out excess leverage, test historical support levels, and create new, lucrative entry points for disciplined investors. By mastering your trading psychology, implementing unyielding risk control, and understanding the macroeconomic triggers driving the price action, you can transform market volatility into your greatest advantage.
Do not let a single red day derail your long-term financial goals. Reassess your technical levels, adjust your risk parameters, and stay fiercely objective.
Frequently Asked Questions
Why is the market down today across both crypto and stocks?
Cross-asset sell-offs typically occur when there is a fundamental shift in macro factors. Triggers such as higher-than-expected inflation reports, changes in Federal Reserve interest rate projections, or unexpected geopolitical tensions cause investors to reduce their exposure to risk universally, leading to synchronized drops in both equities and digital assets.
How should I adjust my portfolio when the market is crashing?
During a sharp market decline, prioritize capital preservation above all else. Reduce your position sizes, tighten your stop-losses, and consider increasing your cash reserves. Active traders should also look into hedging strategies, such as buying put options or trading inverse ETFs, to offset potential losses in a long-term portfolio.
Can a down market provide good trading opportunities?
Absolutely. Market drawdowns often flush out weak hands and over-leveraged traders, creating deeply "oversold" conditions. These environments present highly lucrative opportunities for active traders to short the market or for long-term investors to accumulate high-quality assets at a significant discount once a true bottom is technically confirmed.
How long do market corrections typically last?
The duration of a market correction depends entirely on the underlying macro catalyst. A technical pullback driven by short-term profit-taking may last only a few days to a couple of weeks. However, a structural bear market triggered by an economic recession, liquidity crisis, or prolonged tightening of monetary policy can persist for several months or even years. Always rely on price action and technical confirmation rather than guessing a timeline.