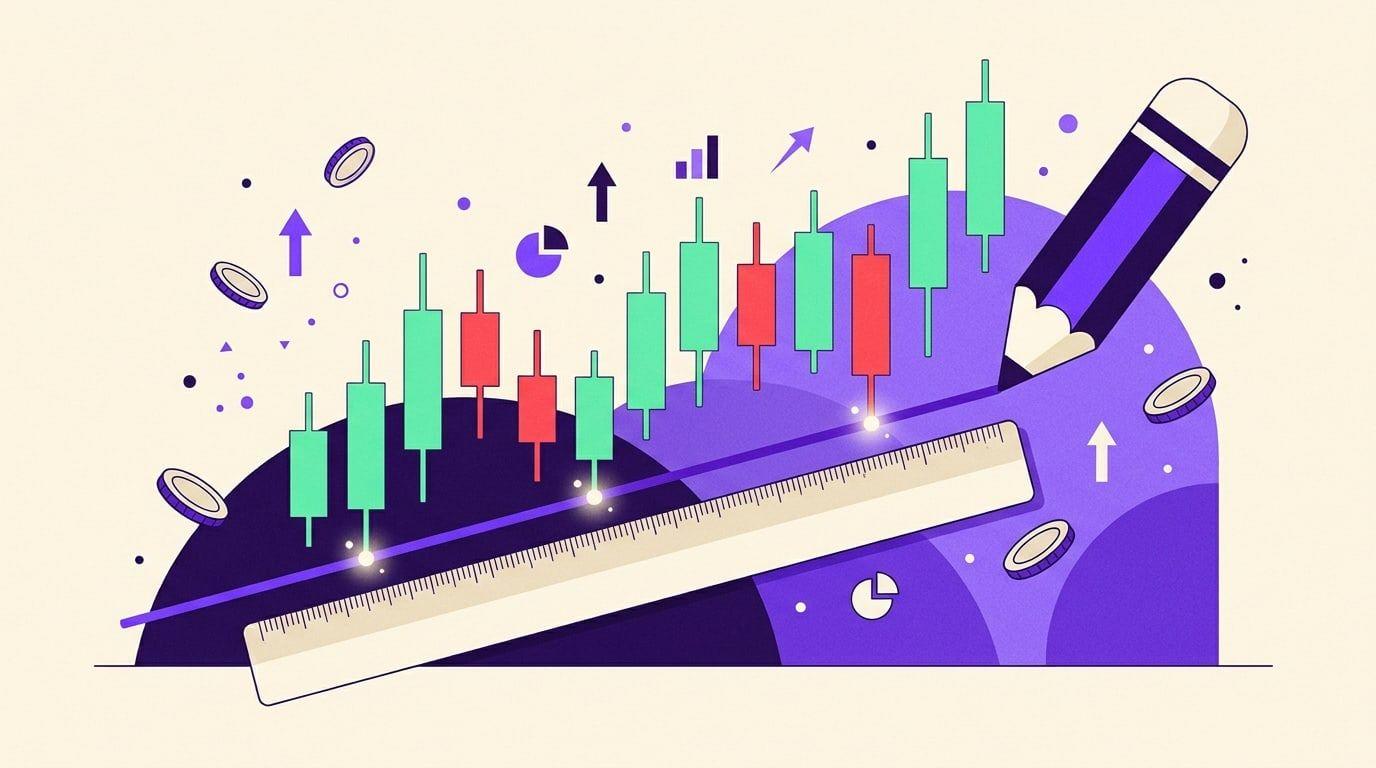
To draw a trendline, connect two confirmed swing lows in an uptrend, or two confirmed swing highs in a downtrend, so that the line runs under price (or over it) without cutting through the candles in between. Two points draw the line, and a third touch confirms it. When price reaches the line again, judge a break on the candle's close, not on its wick.
That is the whole method in three sentences. This guide shows how to apply it without fooling yourself: which points to pick, wicks or bodies, how steep is too steep, why the price scale changes the line, and two real Bitcoin trendlines from 2025, one that broke cleanly and one that didn't.
- Connect confirmed swing lows in an uptrend and swing highs in a downtrend. Two points draw the line, a third touch confirms it.
- Use wicks or bodies, but stay consistent, and never let the line cut through the candles between your points.
- Moderate slopes last; a line drawn through a near-vertical rally rarely holds.
- On long Bitcoin lines the scale matters: the same two lows gave break dates 11 days and about 9% apart on a linear and a log chart.
- Judge a break on a close and treat it as a warning: in October 2025, Bitcoin closed back above a broken line on 6 of the next 12 days.
What a trendline tells you
A trendline is a straight line that follows a trend. In an uptrend it runs along the rising lows and acts as support. In a downtrend it runs along the falling highs and acts as resistance. As StockCharts' ChartSchool explains, a break below a rising line suggests that demand has weakened, and a break above a falling line suggests that supply is easing.
Two limits are worth knowing from the start:
- It's a drawing, not a calculation. Two traders can look at the same chart and draw different lines. The rules below make your lines more consistent, not objective.
- A break is a warning, not a verdict. Incredible Charts puts it simply: trendline breaks "signal a change in momentum; not necessarily a change in trend."
How to draw a trendline, step by step
- Choose the timeframe first. A line on the 4-hour chart and a line on the weekly chart describe different trends. Draw on the timeframe you actually trade; our guide to the best timeframe for crypto trading helps with that choice.
- Find confirmed swing points. A swing low is a low with higher lows on both sides of it; a swing high is the reverse. The newest low on the chart is not a swing low yet, because price may still go lower, so wait for a few candles to form to its right. Thomas Bulkowski makes the same point: a touch on the latest bar may not count yet.
- Connect two of them. In an uptrend, connect two rising swing lows. In a downtrend, connect two falling swing highs. The line sits under price in an uptrend and over price in a downtrend.
- Check the space between the points. The line should not slice through the candles between your two points. If it does, you picked the wrong points. ChartSchool's advice when the lows or highs don't line up: "it is best not to force the issue."
- Extend the line to the right and wait for a third touch. "It takes two points to draw a trend line, and the third one confirms the validity," says ChartSchool. The touch doesn't have to be exact; a turn close to the line counts.
- Redraw when the trend changes pace. Trends speed up and slow down. Incredible Charts notes that several trendlines may break before the trend actually reverses, so a broken line is often replaced by a new one with a different slope.
Wicks or bodies?
There is no single rule, and the classic sources differ. What they agree on is consistency: pick one method for a chart and keep it.
| Method | Where it fits | Watch out for |
|---|---|---|
| Through the wicks (highs and lows) | The classic method, short-term charts | One panic wick can tilt the whole line |
| Through the bodies or closes | Long-term charts, very wicky markets | The line touches fewer extremes |
| An internal line that ignores a spike | A chart with one or two outlier wicks | It's easy to fit the line to what you want to see |
Incredible Charts suggests drawing through the lows (or highs) on short-term charts and through closing prices on long-term charts. If one day's high or low gets in the way of an obvious line, it says you can ignore it, but you should not cut through closing prices. A practical combination: count touches on the wicks, but judge breaks only on closes. That is how the two Bitcoin examples below are read.
What makes a trendline more reliable
- More touches. Bulkowski's rule is that price "should touch the trendline at least three times." Every extra touch adds weight.
- Well-spaced touches. ChartSchool describes the ideal line as one with "relatively evenly spaced lows (or highs)". Touches crowded together say little; Bulkowski adds that touches "spaced farther apart make for a more significant line."
- A moderate slope. "As the steepness of a trend line increases, the validity of the support or resistance level decreases," according to ChartSchool. Bulkowski finds that modest slopes, "say 30 degrees or so, tend to be lasting," while steep ones end quickly. The angle on your screen depends on how the chart is stretched and on the price scale, so compare slopes on the same chart, not across charts.
Linear or log scale?
On a linear scale, every 1,000 dollars takes the same height. On a log scale, every 10% move does. For short lines on intraday charts the difference is tiny. For lines that span big moves, which on Bitcoin means most lines longer than a few months, it matters a lot. ChartSchool notes that highs and lows "appear to line up better for trend lines when prices are displayed using a semi-log scale," especially for long-term lines and large price changes.
Here is how much it matters. We took the same two Bitcoin daily lows, August 5, 2024 (49,000) and April 7, 2025 (74,508), on Binance's BTCUSDT pair, and drew the line through them on both scales:
| Same two lows, two scales | Linear scale | Log scale |
|---|---|---|
| First daily close below the line | Nov 14, 2025 | Nov 3, 2025 |
| Line value on that day | about 97,500 | about 106,700 |
Same anchor points, 11 days and about 9% apart. Neither line is "right"; the scale is simply part of the drawing. Decide on it before you draw, use a log scale for long Bitcoin lines, and redraw if you switch.
How to judge a break: closes, not wicks
A line is broken when a candle closes beyond it. A wick that pokes through and closes back inside is a test of the line, not a break. Two real examples from 2025 show both sides. The data are Binance BTCUSDT daily candles (UTC), from Binance's public market data API.
A clean break: the falling line of early 2025

The line connects Bitcoin's daily highs of January 20 (109,588) and February 21 (99,475). The highs of late March stalled within about 1% of it: the third touch. On April 2 a wick pushed 1.9% above the line, but the day closed 5% below it, a test rather than a break. The first daily close above the line came on April 12, at 85,277, about 1.9% over it, and price didn't close back below the line for the rest of April.
A messy break: the rising line of 2025

This line connects the daily lows of May 6 (93,377) and June 22 (98,200), and the September 26 low came within about 0.5% of it. On October 10, a sharp sell-off pushed the daily low 6.8% below the line, yet the candle closed 3% above it. Judged on closes, the line held that day. The first close below came on October 16, 1.7% under the line. Over the next 12 days, though, Bitcoin closed back above the line six times, by as much as 3.1%. Only from October 29 did the daily closes stay below it.
What to take from the two charts:
- Wait for the close of the candle on your timeframe. On October 10, a trader who reacted to the wick would have acted on a line that, by the close, still held.
- Ask for a margin. A close a fraction of a percent past the line is a weak break. Some traders require the close to clear the line by a set amount, scaled to how much the coin usually moves. Even that is no guarantee: in October, the closes back above the line reached 3.1%.
- Look for confirmation. ChartSchool says trendline breaks "should not be the final arbiter" and suggests checking them against other tools, such as horizontal support and resistance or the sequence of highs and lows. Our guide to false breakouts in crypto covers the warning signs.
A trendline break tells you the trend may be changing, not that it has. If you act on one, decide before you enter where the idea is wrong and how much a failed break may cost you: in October 2025, Bitcoin closed back above a broken line on 6 of the next 12 days.
From trendlines to chart patterns
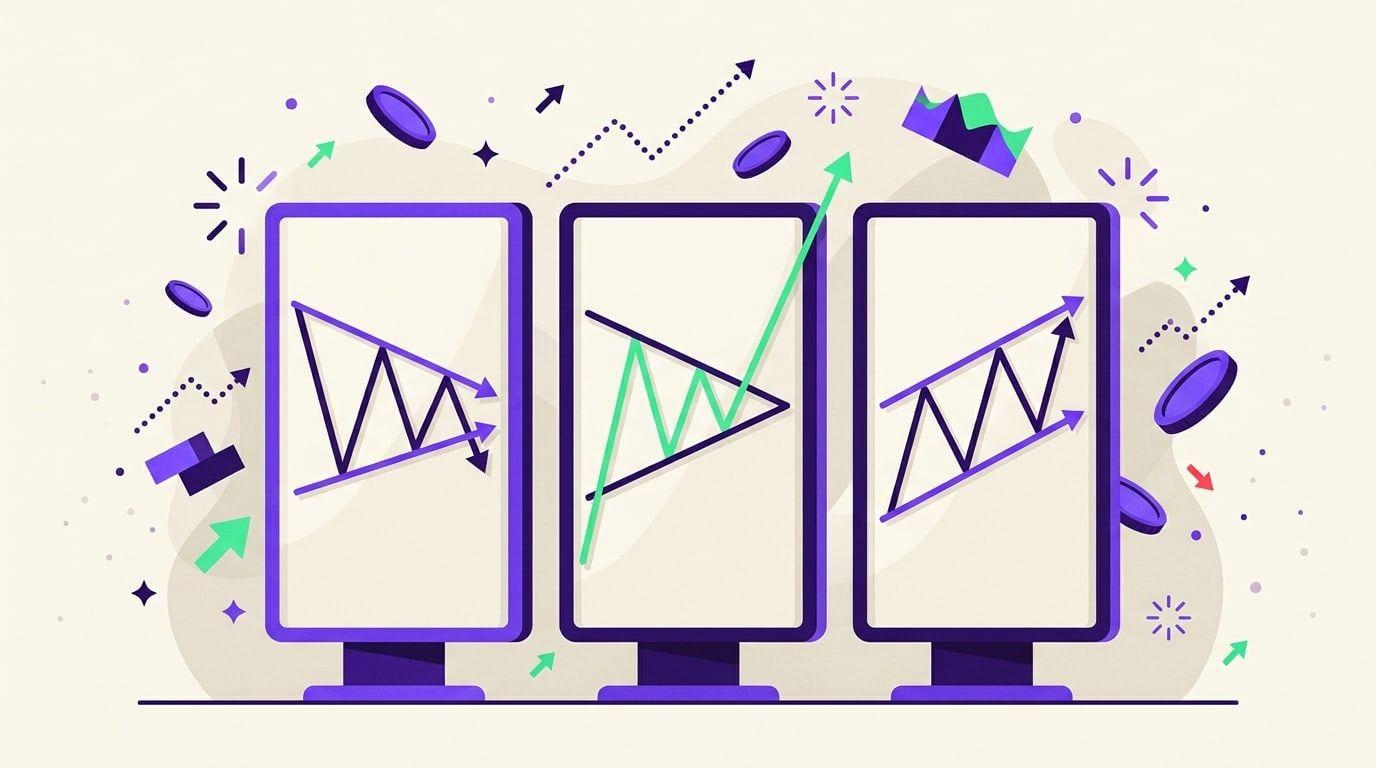
Two trendlines together make a chart pattern. When they converge, you get a triangle or a wedge. When they run parallel, you get a channel. Every rule above applies to both lines at once: confirmed turning points, no lines through candles, and breaks judged on closes.
That is how the Navixa Price Action strategy works on TradingView. It looks for eight shapes: rising and falling wedges; symmetrical, ascending and descending triangles; and ascending, descending and horizontal channels. It draws a pattern only after its last turning point is confirmed and never repaints it. It enters only when a candle closes beyond the pattern line by a margin scaled to the coin's volatility, and it sets the stop, two targets and the position size at that close.
In its published Bitcoin backtest (BTCUSDT.P, 4-hour chart, October 2019 to October 2026, fees and slippage included), triangles made 38 of the 58 trades and +5,783 USDT, while channels traded only three times. The split by pattern shows which shapes earned their place. These are past results on one coin, not a promise for the future.
Drawing trendlines on TradingView
- The Trend Line tool sits with the other line tools in the left toolbar. Click the first swing point, then the second.
- To keep a line running into the future, use the Extended Line tool, which "extends indefinitely in any direction," as TradingView's help center describes it.
- You can put an alert on a drawn line. TradingView's guide to technical alerts lists Crossing, Crossing up and Crossing down for lines. A wick can cross the line in the middle of a candle, so if you only care about closes, pick the Once per bar close frequency, which waits for the bar to close before it triggers, as TradingView's note on alert frequencies explains.
- Set the price scale, linear or log, before you draw, and keep it.
Common mistakes
- Forcing a line through candle bodies so that it fits.
- Mixing wicks and bodies on the same line.
- Anchoring the line on the latest low or high before it is confirmed.
- Drawing a steep line through a near-vertical rally and expecting it to hold.
- Treating a wick through the line as a break.
- Keeping an old line forever instead of redrawing when the trend changes pace.
- Switching between linear and log scale without redrawing.
FAQ
How many touches make a valid trendline?
Two points are enough to draw a line, but most technicians want a third touch before they trust it. ChartSchool says at least three points should connect before a line counts as a valid trendline, and Bulkowski also looks for at least three touches.
Should you draw trendlines on wicks or bodies?
Either works if you stay consistent. Wicks are the classic choice on short-term charts; bodies or closes often fit better on long-term charts or when a few extreme wicks distort the picture. Whichever you use, judge breaks on closes.
What is the best timeframe for trendlines?
The one you trade. Lines on higher timeframes describe longer trends and are redrawn less often; lines on lower timeframes describe short swings. Draw the line on the same chart you use to plan your entries and exits.
Do trendlines work in crypto?
They describe a trend; they don't predict one. The two Bitcoin examples above show a clean break and a break that went back and forth for almost two weeks. Use trendlines to frame where the trend is, and plan your exit before you act on a break.
The bottom line
Draw from confirmed swing points, let a third touch confirm the line, keep wicks or bodies consistent, use a log scale for long Bitcoin lines, and judge breaks on closes, as warnings rather than verdicts. If you'd rather have those rules applied the same way on every chart, the Price Action strategy does it for wedges, triangles and channels, with the stop and both targets of every trade set at the breakout close.