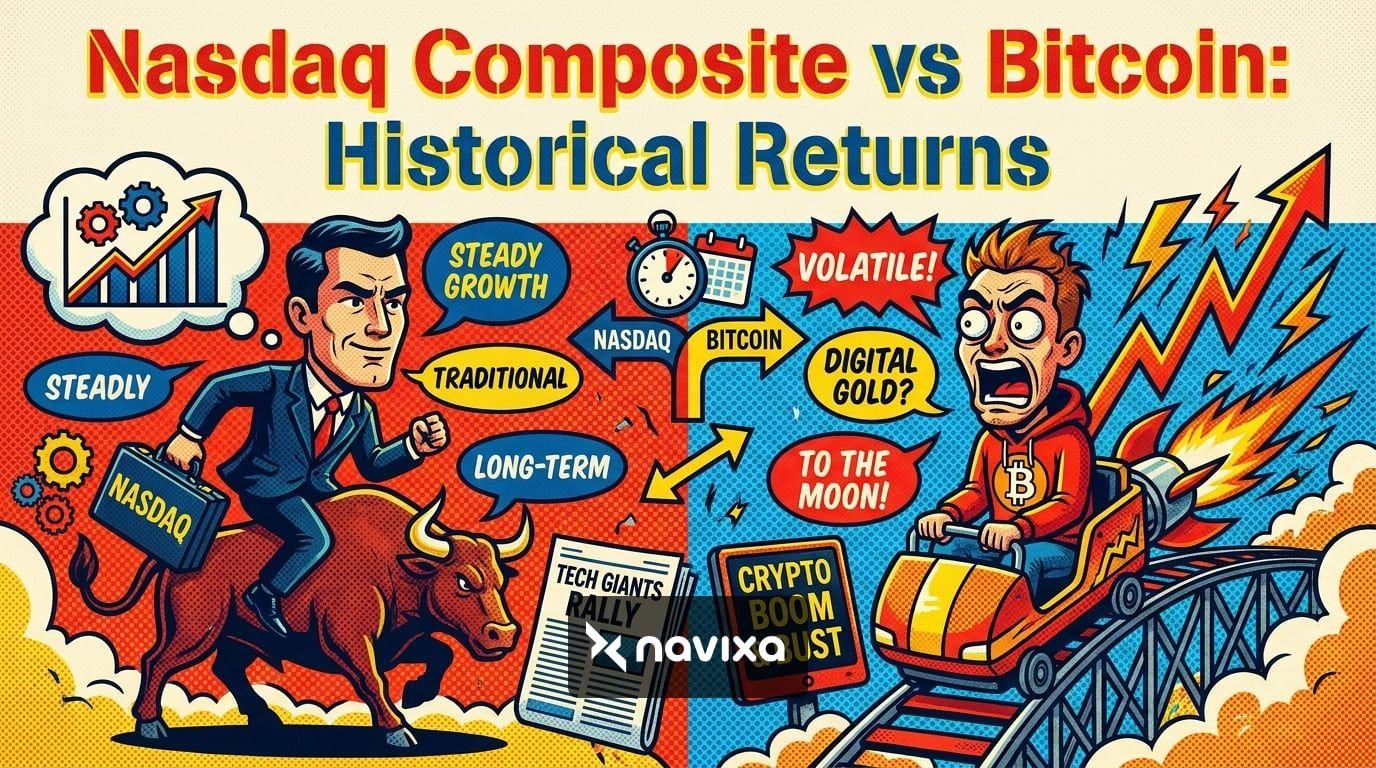
For years, the narrative has been simple: Bitcoin moves like a tech stock. When the Dow Jones Industrial Average (DJIA) or the Nasdaq rallies, Bitcoin typically follows suit, fueled by the same liquidity cycles and risk-on sentiment. However, late 2024 and 2025 have challenged this assumption, presenting traders with a complex, evolving landscape of correlation and decoupling.
As of December 2025, the relationship between the world's leading cryptocurrency and the United States' oldest stock index has shifted dramatically. While the Dow Jones has seen double-digit gains driven by the AI boom and resilient industrial earnings, Bitcoin has faced a more volatile path, struggling to keep pace in a year that many expected to be a synchronized bull run.
Understanding the Bitcoin Dow Jones correlation is no longer just about watching two charts move in tandem; it is about recognizing when the link breaks and how to profit from that divergence. This guide explores the mechanics of this relationship, why it matters, and actionable strategies for trading the convergence and divergence of these two massive asset classes.
The Mechanics of the Correlation
Correlation in finance measures how two assets move in relation to one another. A correlation coefficient of +1.0 means they move in perfect lockstep, while -1.0 implies they move in exact opposites. A score of 0 indicates no relationship at all.
Historically, Bitcoin acted as an uncorrelated asset—a true "digital gold" that moved independently of traditional finance. However, the institutionalization of crypto changed this dynamic. As hedge funds, family offices, and public companies (like MicroStrategy and Tesla) added Bitcoin to their balance sheets, the asset began to react to the same macroeconomic triggers as the stock market: interest rates, inflation data, and Federal Reserve policy.
The 2020–2024 Synchronization
From the COVID-19 crash in March 2020 through late 2024, the correlation was undeniably strong. During this period of "easy money" followed by aggressive rate hikes, Bitcoin traded like a high-beta tech stock. When the Dow or Nasdaq fell due to hawkish Fed comments, Bitcoin often fell harder. Conversely, when liquidity returned, both assets rallied.
Traders used the Dow Jones Industrial Average as a leading indicator. If Dow futures were up pre-market, crypto traders would aggressively long Bitcoin, anticipating a spillover of risk appetite. This strategy worked reliably for nearly four years.
The 2025 Divergence Event
The year 2025 has marked a pivotal shift. While the Dow Jones continued to climb, driven by the massive growth of AI-integrated industrial sectors and energy companies, Bitcoin faced distinct headwinds. Regulatory uncertainty, specific tariff concerns affecting mining hardware, and a rotation of retail capital into other speculative assets caused Bitcoin to lag.
For the first time in a decade, we are seeing a year where the S&P 500 and Dow Jones may finish with significant gains while Bitcoin risks ending the year flat or in the red. This "decoupling" means that blind correlation trading—buying BTC simply because stocks are up—is no longer a guaranteed winning strategy.
Analyzing the Data: Dow Jones vs. Bitcoin
To trade effectively, you must understand the structural differences between these two markets. The Dow represents 30 prominent blue-chip companies, heavily weighted towards industrials, financials, and healthcare. Bitcoin is a decentralized digital commodity with a fixed supply schedule.
Below is a comparison of their key trading characteristics to help identify opportunities:
| Feature | Dow Jones (DJIA) | Bitcoin (BTC) |
|---|---|---|
| Market Hours | Mon-Fri, 9:30 AM - 4:00 PM EST | 24/7, 365 Days a Year |
| Primary Drivers | Corporate Earnings, GDP, Fed Rates | Network Adoption, Halving Cycles, Liquidity |
| Volatility Profile | Low to Moderate (10-20% annualized) | High (40-80% annualized) |
| Safe Haven Status | Considered safe in defensive sectors | Debated (Digital Gold vs. Risk Asset) |
| 2025 Trend | Consistent Bullish Trend | High Volatility / Decoupling |
Trading Strategy 1: The Risk-On Convergence Play
Despite the 2025 divergence, there are still frequent periods where correlation spikes, usually driven by sudden macroeconomic shifts. When the Federal Reserve announces a surprise rate cut or inflation data comes in lower than expected, "a rising tide lifts all boats."
How to Execute:
1. Watch Pre-Market Futures: If Dow Jones futures (YM) are rallying aggressively (over +0.5%) before the NY open, look for a breakout setup in Bitcoin. Bitcoin often "front-runs" the stock market open because it trades 24/7.
2. Confirm with VIX: The CBOE Volatility Index (VIX) generally moves inversely to both stocks and Bitcoin. If the VIX is crashing below 15, it confirms a risk-on environment where both assets should rise.
This strategy works best on intraday timeframes (15-minute to 1-hour charts) immediately following major economic news releases.
Trading Strategy 2: The Divergence Play (Alpha Trading)
The most profitable trades in 2025 have come from recognizing when the correlation breaks. This happens when crypto-specific narratives overpower macro sentiment. For example, regulatory approval of new crypto derivatives or ETF inflows can send Bitcoin higher even if the Dow is flat or falling.
Conversely, stock-specific rotations (like capital flowing from Tech into Utilities) might boost the Dow while leaving Bitcoin behind. Identifying these decoupling events protects you from holding a stagnant asset during a bull market elsewhere.
Signs of Decoupling:
• Relative Strength Divergence: If the Dow makes a higher high while Bitcoin makes a lower high (or vice versa), the correlation is weakening. This often signals a rotation of capital.
• Volume Discrepancies: High volume in stocks but low volume in crypto suggests that institutional focus is currently on equities, and Bitcoin may drift sideways regardless of the stock rally.
For real-time data on these market movements, checking resources like CoinDesk or TradingView can provide the necessary charts to spot these divergences early.
Pairs Trading: Long Dow / Short Bitcoin (or Vice Versa)
Sophisticated traders often use a pairs trading strategy to exploit the spread between the two assets. This involves going long on the stronger asset and short on the weaker one, thereby hedging out general market risk.
In 2025, a popular institutional trade has been Long Dow / Neutral Bitcoin. Traders bought industrial stocks anticipating that tariffs would boost domestic production, while remaining cautious on Bitcoin due to the same tariffs potentially impacting hardware costs.
Pro Tip: Do not simply look at the price. Look at the Rolling 30-Day Correlation Coefficient. When this number drops near 0 or turns negative, pairs trading becomes highly effective because the assets are moving independently.
Macro Factors to Watch in 2026
As we look ahead, three main drivers will dictate whether the Bitcoin-Dow Jones correlation tightens or continues to fray:
1. The Weak Dollar Index (DXY)
Both Bitcoin and the Dow tend to rise when the US Dollar weakens. If the Fed pursues a strategy of currency debasement to manage national debt, we could see a return to high correlation where both assets rally together against the dollar.
2. Regulatory Clarity
The stock market hates uncertainty, and so does crypto. However, crypto faces existential regulatory risks that the Dow does not. Clearer crypto regulations in the US could remove the "risk premium" on Bitcoin, allowing it to trade more in line with traditional tech stocks again.
3. The AI Productivity Boom
The Dow's recent performance is heavily tied to AI productivity gains in legacy companies. Bitcoin does not directly benefit from AI efficiency in the same way. If the "AI trade" continues to dominate the market, stocks may continue to outperform Bitcoin unless Bitcoin finds a new narrative (such as AI-native payments).
Conclusion: Adaptability is Key
The days of assuming Bitcoin is just a "24/7 NASDAQ" are over. The 2025 divergence between the Dow Jones and Bitcoin has taught traders a valuable lesson: asset classes evolve. While macroeconomics will always link them loosely, their individual drivers—corporate earnings for the Dow and adoption cycles for Bitcoin—are asserting themselves more strongly.
Successful traders in 2026 will be those who monitor the correlation coefficient dynamically. They will ride the wave when the assets converge during macro-panic events and smartly decouple their strategies when idiosyncratic trends take over.
Whether you are hedging a stock portfolio with crypto or looking for alpha in a stagnant equity market, understanding the Bitcoin Dow Jones correlation gives you a distinct edge. Keep your eye on the data, respect the trend, and never assume the correlation is permanent.