For years, the narrative was simple: Bitcoin is a risk-on asset that acts like a leveraged version of the SP500. When tech stocks rallied, crypto soared. When Wall Street sneezed, Bitcoin caught a cold. However, as we move deeper into the current market cycle, that relationship has evolved into something far more nuanced—and profitable for those who know how to read it.
Trading the correlation between the S&P 500 (SPX) and Bitcoin (BTC) is no longer just about blindly buying both during a bull market. It requires identifying specific correlation regimes—periods where they move in lockstep versus periods of distinct decoupling. By understanding the underlying drivers of liquidity, inflation data, and institutional flows, traders can exploit these inefficiencies for significant gains.
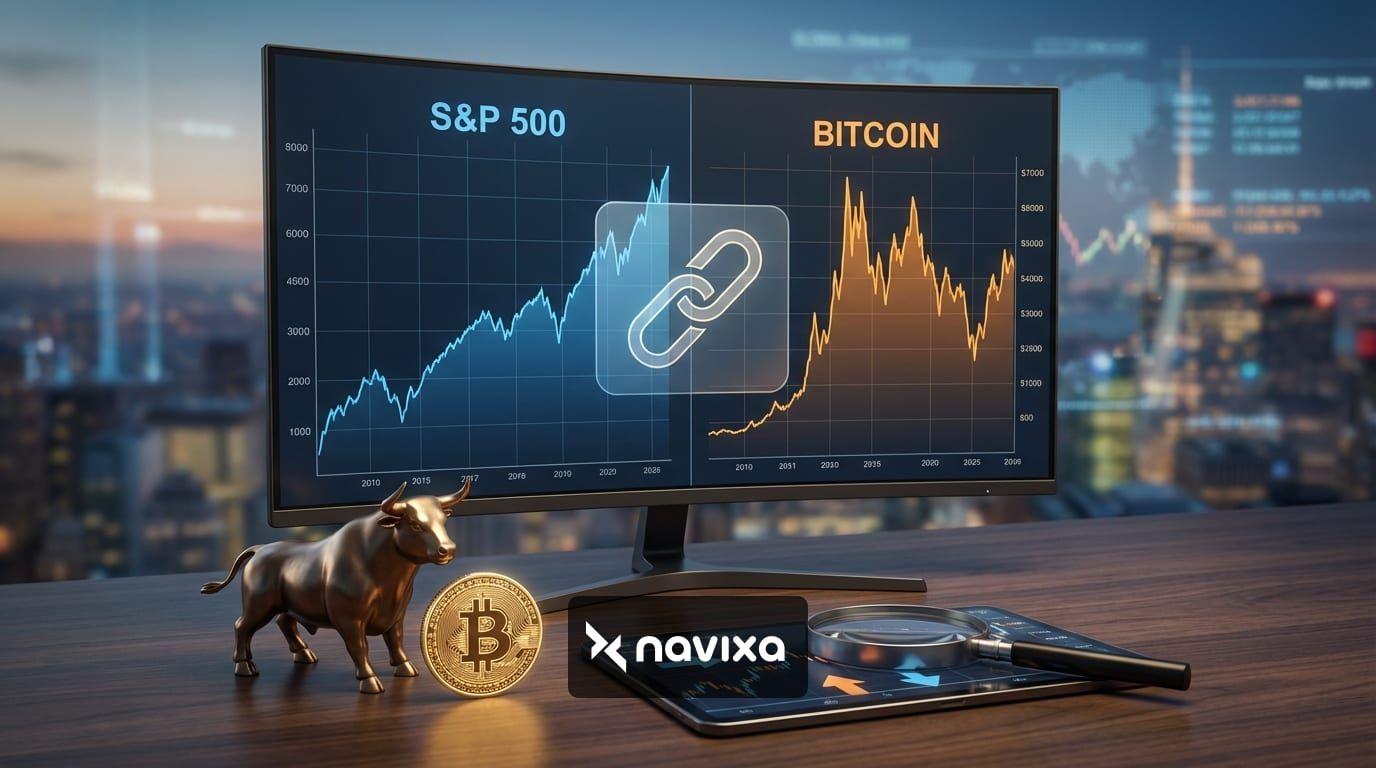
This guide provides a professional framework for analyzing and trading the SP500-Bitcoin relationship, moving beyond basic observations to actionable strategies used by hedge funds and prop traders.
The Mechanics of the Correlation
To trade the pair, you must first understand why they are linked. The primary connective tissue is global liquidity. Both the SP500 and Bitcoin are sensitive to the cost of capital. When the Federal Reserve lowers interest rates or injects liquidity (QE), capital flows into risk assets. Since Bitcoin sits further out on the risk curve than blue-chip stocks, it often acts as a "high-beta" play on the same macro thesis.
However, divergence occurs when idiosyncratic factors take over. For the SP500, this could be earnings reports from the "Magnificent Seven" or sector-specific regulation. For Bitcoin, drivers include halving cycles, spot ETF inflows, or on-chain metrics. Recognizing which driver is dominant—Macro (Correlation) or Idiosyncratic (Divergence)—is Step 1.
Positive vs. Negative Correlation Regimes
The correlation coefficient ranges from +1 (perfect synchronization) to -1 (perfect inverse movement).
• High Positive Correlation (> 0.7): Usually seen during extreme macro events (e.g., inflation shocks, Fed meetings). In this regime, Bitcoin is essentially a leveraged Nasdaq position.
• Decoupling/Low Correlation (< 0.3): Often occurs when crypto has specific catalysts (e.g., ETF approvals) or when equities are flat while crypto consolidates. This is where diversification benefits are maximized.
Tale of the Tape: SP500 vs. Bitcoin
Before executing a trade, it is vital to understand the structural differences between these two assets. The table below highlights the key characteristics that impact strategy execution.
| Feature | S&P 500 (SPX) | Bitcoin (BTC) |
|---|---|---|
| Trading Hours | Mon-Fri, 9:30 AM - 4:00 PM ET | 24/7/365 |
| Annualized Volatility | ~10% - 20% | ~40% - 60% |
| Primary Drivers | Corporate Earnings, Fed Rates, GDP | Liquidity, Network Adoption, Halving |
| Leverage Availability | Regulated (2x-4x typically) | High (up to 100x on offshore exchanges) |
| Weekend Behavior | Closed (Futures active Sunday evening) | Active (Often predicts Monday open) |
Strategy 1: The Lead-Lag "Beta" Play
In a high-correlation regime, the S&P 500 (and specifically the Nasdaq 100) often acts as a leading indicator for Bitcoin on intraday timeframes. High-frequency algorithms trade these assets in pairs. When the SP500 breaks a key resistance level on significant volume, Bitcoin often lags by seconds or minutes before following suit.
Execution Steps:
1. Overlay Charts: Use a charting platform like TradingView to overlay the SPX500USD CFD chart on top of the BTCUSD chart.
2. Identify Key Levels: Mark the daily high and low for the SP500.
3. Wait for the Breakout: If the SP500 breaks resistance with momentum (large green candles), check Bitcoin. If BTC has not yet broken its corresponding local resistance, enter a Long position on BTC.
4. Target & Stop: Target the next liquidity zone. Place stops tight, as the correlation trade relies on immediate follow-through.
Strategy 2: The Weekend Gap Fade
One of the most powerful strategies involves the difference in trading hours. The S&P 500 closes on Friday afternoon and reopens on Sunday evening (futures). Bitcoin trades 24/7. During the weekend, Bitcoin effectively price-discovers for the global market.
If substantial news breaks over the weekend (e.g., geopolitical escalation) and Bitcoin drops 5%, it is highly probable that the S&P 500 futures will "gap down" at the Sunday open. Sophisticated traders can position themselves for this gap.
Pro Tip: Watch the Sunday afternoon session (3 PM – 6 PM ET) in Crypto. This is often when institutional desks begin positioning for the Asian market open and the US futures open. A sharp rally here often predicts a 'green' open for the SP500.
Strategy 3: Trading the Divergence (Relative Value)
When the correlation breaks, a "Relative Value" strategy becomes viable. This involves going long the strong asset and shorting the weak asset, effectively hedging out market risk to capture the spread.
For example, if the SP500 is making new highs but Bitcoin is stalling or dropping despite a lack of negative crypto news, it suggests a temporary capital rotation. A trader might Short SP500 (expecting mean reversion) and Long Bitcoin (expecting catch-up), or simply trade the ratio.
Calculating the Ratio
Create a chart of BTCUSD / SPX. Analyze this chart using standard technical analysis (Support/Resistance, RSI). If the ratio hits a multi-year support level, it implies Bitcoin is historically cheap relative to the stock market, favoring a 'Long BTC' bias.
Risk Management: The Volatility Adjuster
The biggest mistake traditional traders make when moving to crypto is applying the same position sizing. Bitcoin is roughly 3x to 4x more volatile than the SP500 on an annualized basis.
If you typically risk 1% of your account on an SP500 trade with a 50-point stop, a similar setup on Bitcoin requires significantly smaller size to maintain the same dollar risk. Always adjust your position size by the volatility ratio. A standard rule of thumb is to trade 1/3rd of your usual equity size when entering Bitcoin positions compared to SP500 positions.
Conclusion: Adapting to the New Normal
The relationship between the SP500 and Bitcoin is not static. It breathes, tightens, and decouples based on the macroeconomic environment. In 2025, as institutional adoption matures, we are seeing Bitcoin behave less like a speculative toy and more like a distinct asset class that occasionally dances with equities.
Successful traders do not bet on the correlation remaining permanent. Instead, they measure the correlation daily, identify the regime, and deploy the appropriate strategy—Lead-Lag for high correlation days, and Relative Value for divergence days. By respecting the volatility difference and monitoring the weekend gaps, you can turn the SP500 vs. Bitcoin dynamic into a consistent edge in your trading portfolio.