The S&P 500 futures market is one of the most liquid and actively traded financial arenas in the world. For traders looking to capitalize on the price movements of the top 500 US companies, mastering S&P 500 futures price action is an absolute necessity. Instead of relying on lagging indicators that tell you what happened in the past, price action trading allows you to read the market's raw footprint, giving you a real-time edge.
"Price action is the rawest footprint of institutional intent. By reading the tape and observing how price reacts at key levels, retail traders can ride the coattails of the market makers."
In this comprehensive guide, we will break down the mechanics of trading the E-mini (ES) and Micro E-mini (MES) S&P 500 futures. We will explore high-probability price action strategies, essential chart patterns, actionable daily routines, and strict risk management rules to elevate your trading performance.
Understanding S&P 500 Futures Price Action
At its core, price action trading is the discipline of making trading decisions based purely on the price movement of an asset, rather than relying on complex, derived technical indicators like MACD or RSI. When you strip away the noise of moving averages and oscillators, you are left with the purest representation of market psychology: price and volume.
In the context of the S&P 500 futures, price action reflects the collective buying and selling decisions of institutional algorithms, hedge funds, commercial hedgers, and retail day traders. Because the E-mini S&P 500 (ES) is incredibly liquid, it respects key technical levels, trendlines, and supply/demand zones with remarkable precision.
Traders who specialize in S&P 500 futures price action look for clues in candlestick formations, swing highs and lows, and the speed of price movement. A sudden, aggressive rejection at a prior day's high, for example, tells a price action trader that sellers are aggressively defending that level, offering a high-probability shorting opportunity.
Key Contract Specifications: ES vs. MES
Before deploying any strategy, you must understand the instruments you are trading. The Chicago Mercantile Exchange (CME) offers two primary ways for retail traders to participate in S&P 500 futures: the E-mini (ES) and the Micro E-mini (MES).
The Micro contract, introduced to lower the barrier to entry, is exactly one-tenth the size of the standard E-mini. This allows traders with smaller accounts to participate in the exact same S&P 500 futures price action with reduced financial risk.
| Feature | E-mini S&P 500 (ES) | Micro E-mini S&P 500 (MES) |
|---|---|---|
| Contract Multiplier | $50 x S&P 500 Index | $5 x S&P 500 Index |
| Tick Size | 0.25 Index Points | 0.25 Index Points |
| Tick Value | $12.50 per tick | $1.25 per tick |
| Point Value | $50.00 per point | $5.00 per point |
| Trading Hours | Sun-Fri, 6:00 PM - 5:00 PM ET | Sun-Fri, 6:00 PM - 5:00 PM ET |
For more detailed information on margin requirements and contract specifications, you can visit the official CME Group website.
Essential Price Action Strategies for the S&P 500
To succeed in the ES or MES, you need a playbook of reliable setups. Here are three proven strategies that rely entirely on reading price action.
1. Support and Resistance Breakout and Pullback
One of the most foundational ways to trade the S&P 500 futures is through breakouts and subsequent pullbacks. The ES frequently consolidates in tight ranges before institutional volume drives it into a new trend.
However, trading the initial breakout can be dangerous due to the high frequency of "fakeouts" or false breakouts. A safer, higher-probability approach is the breakout-and-pullback strategy. - The Setup: Wait for the price to break definitively through a major support or resistance level with strong momentum (large candlestick bodies). - The Trigger: Do not enter on the breakout. Instead, wait for the price to retrace and test the broken level. A former resistance level should now act as support. - The Entry: Enter the trade when you see a confirming price action signal, such as a bullish pin bar or engulfing candle, rejecting the new support level.
2. The Opening Range Breakout (ORB)
The US cash equity market opens at 9:30 AM Eastern Time. The first 15 to 30 minutes of the regular trading hours (RTH) are typically characterized by massive volume and volatility as overnight orders are executed and institutions position themselves for the day.
The Opening Range Breakout (ORB) strategy capitalizes on this volatility. - The Setup: Define the high and low of the first 15 minutes of trading (9:30 AM to 9:45 AM ET). This creates your "Opening Range." - The Trigger: Watch for price to break outside of this 15-minute range. - The Entry: If the price breaks the opening range high with strong volume, look for a long entry. If it breaks the opening range low, look for a short entry. Stop losses are typically placed just inside the midpoint of the opening range to protect against sudden reversals.
3. Supply and Demand Zone Trading
Supply and demand trading is an advanced form of support and resistance. Instead of looking at single price lines, traders identify broader zones where massive institutional buying or selling previously occurred.
When analyzing S&P 500 futures price action, a demand zone is created when the price drops to a specific area and then violently shoots upward, leaving behind a "footprint" of aggressive buying. When the price eventually returns to this zone, it is highly likely to bounce again as unfilled institutional limit orders are triggered. - The Setup: Look for areas on a 1-hour or 4-hour chart where price exploded away from a base. Draw a rectangle around the consolidation prior to the explosion. - The Execution: Switch to a lower timeframe (like a 5-minute chart) and wait for the price to enter the zone. Enter the trade once a localized reversal pattern forms inside the zone.
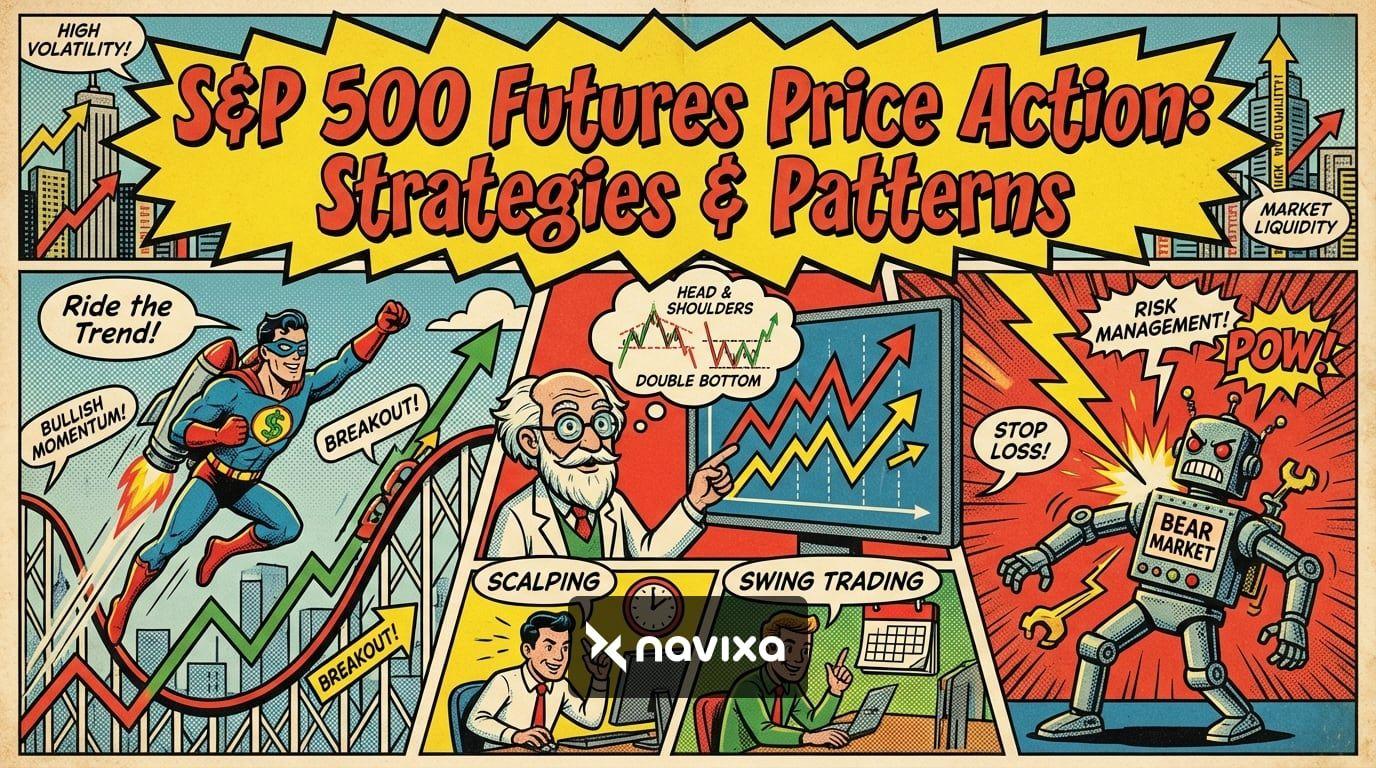
High-Probability Chart Patterns in ES
Chart patterns are visual representations of human psychology and market sentiment. By memorizing these shapes, you can anticipate where the market is likely to go next.
Bull and Bear Flags
Flags are continuation patterns that occur after a strong directional move. In a bull flag, the S&P 500 futures will surge upward (the flagpole) and then slowly consolidate downward in a tight, parallel channel (the flag). This indicates that buyers are taking a breather and absorbing profit-taking before the next leg up. - Trading the Flag: Enter when the price breaks out of the top of the flag channel, placing your stop loss just below the lowest point of the consolidation.
Head and Shoulders (and Inverted)
The Head and Shoulders pattern is one of the most reliable reversal formations in price action trading. It consists of three peaks: a left shoulder, a higher peak (the head), and a lower right shoulder. This pattern illustrates a shift in power from buyers to sellers, as the bulls fail to push the price to a new high on the right shoulder. - Trading the Pattern: Draw a "neckline" connecting the lows of the two shoulders. The entry signal is a decisive close below the neckline, signaling a trend reversal.
Double Tops and Double Bottoms
These are exhaustion patterns. A double top occurs when the ES tests a high price twice but fails to break through, forming an "M" shape. It shows that buyers are exhausted and sellers are aggressively defending the resistance. Conversely, a double bottom forms a "W" shape, indicating strong buying interest at a specific low. - Trading the Pattern: Wait for the price to break the "valley" (for a double top) or the "peak" (for a double bottom) between the two touches to confirm the reversal.
Actionable Steps for Day Trading the S&P 500
To turn these patterns and strategies into a profitable routine, you need a structured daily plan. Trading platforms like NinjaTrader or TradingView offer excellent tools for charting these levels. Here is a step-by-step daily routine for trading S&P 500 futures.
Step 1: Pre-Market Preparation (8:00 AM - 9:30 AM ET) Before the cash market opens, review the macroeconomic calendar. Note any major data releases (like CPI, Non-Farm Payrolls, or FOMC meetings) that could inject unpredictable volatility into the market. Avoid trading directly during these news spikes.
Step 2: Map Key Liquidity Levels Mark up your charts with the most critical price action levels from the previous day and the overnight session. Essential levels include: - Prior Day High (PDH) and Prior Day Low (PDL) - Prior Day Close (Settlement) - Overnight High (ONH) and Overnight Low (ONL)
These levels act as magnets for price. A common mean-reversion trade involves fading a false breakout of the overnight high.
Step 3: Wait for the Dust to Settle Unless you are specifically trading the Opening Range Breakout, it is often wise to sit on your hands for the first 15-30 minutes of the cash open. Let the initial institutional repositioning finish before looking for clear price action setups.
Step 4: Execute with Discipline When your setup appears, execute it without hesitation. Do not chase trades if you miss the entry. In the ES, there is always another setup around the corner.
Risk Management in Futures Trading
Trading S&P 500 futures price action is highly lucrative, but the leverage involved can decimate a trading account if risk is not properly managed. The ES controls $50 per index point. A 20-point move against you equals a $1,000 loss per contract.
1. Use the Micro E-mini (MES) for Smaller Accounts If your account size is under $10,000, you should exclusively trade the MES. This allows you to scale into and out of positions, use wider protective stops, and avoid the emotional stress of large intraday swings.
2. The 1% Rule Never risk more than 1% to 2% of your total account equity on a single trade. If you have a $5,000 account, your maximum risk per trade should be $50. In the MES, a $50 risk allows for a 10-point stop loss on one contract.
3. Always Use Hard Stop Losses Mental stops do not work in futures trading. The S&P 500 can drop 30 points in a matter of seconds driven by breaking news or algorithmic sell-offs. Always place a hard stop-loss order the moment you enter a trade.
4. Focus on Risk-to-Reward Ratios Ensure every trade offers an asymmetric risk-to-reward ratio. Aim for at least a 1:2 ratio, meaning you risk 10 points to make 20 points. With a 1:2 ratio, you only need to be right 40% of the time to remain profitable.
Conclusion
Mastering S&P 500 futures price action is a journey that requires patience, discipline, and screen time. By stripping away complex indicators and focusing purely on the relationship between price and volume, you gain a massive edge in anticipating market movements. Whether you are trading breakouts, supply and demand zones, or classic chart patterns, the key to longevity in the futures market is strict risk management and unwavering emotional control.
Start by practicing these strategies in a simulator, strictly trading the Micro E-mini (MES) until you achieve consistent profitability. When you are ready, the immense liquidity of the S&P 500 futures market awaits.
Frequently Asked Questions
What does price action mean in S&P 500 futures?
Price action refers to the analysis of raw, unfiltered price movements on a chart over time. Instead of relying on lagging technical indicators, traders read candlestick patterns, support and resistance levels, and trendlines to predict the future direction of the S&P 500 index futures.
How much money do I need to day trade S&P 500 futures?
While some brokers offer day trading margins as low as $50 for the Micro E-mini (MES) and $500 for the E-mini (ES), it is highly recommended to have a larger cushion to absorb standard drawdowns. A minimum of $2,000 to $3,000 is ideal for trading a single MES contract safely using proper risk management.
Are E-mini S&P 500 futures better than trading SPY options?
Both have their merits, but futures offer several distinct advantages for day traders. Futures trade nearly 24 hours a day, have no pattern day trader (PDT) rule restrictions, offer more favorable tax treatment (the 60/40 rule in the US), and do not suffer from time decay (theta) or implied volatility crush like options do.
What are the best timeframes for S&P 500 price action trading?
This depends on your trading style. Day traders typically use the 5-minute or 15-minute charts to identify trends, while using a 1-minute or tick chart for precise entries. Swing traders may look at the 1-hour, 4-hour, and daily charts to map out major supply and demand zones.
Why do traders watch the overnight high and low?
The overnight session (Globex) establishes the high and low prices recorded before the regular US market opens. These levels act as major liquidity pools. During regular trading hours, price will often gravitate toward these levels to trigger resting stop orders before reversing, offering high-probability mean-reversion setups.