stock trading strategies
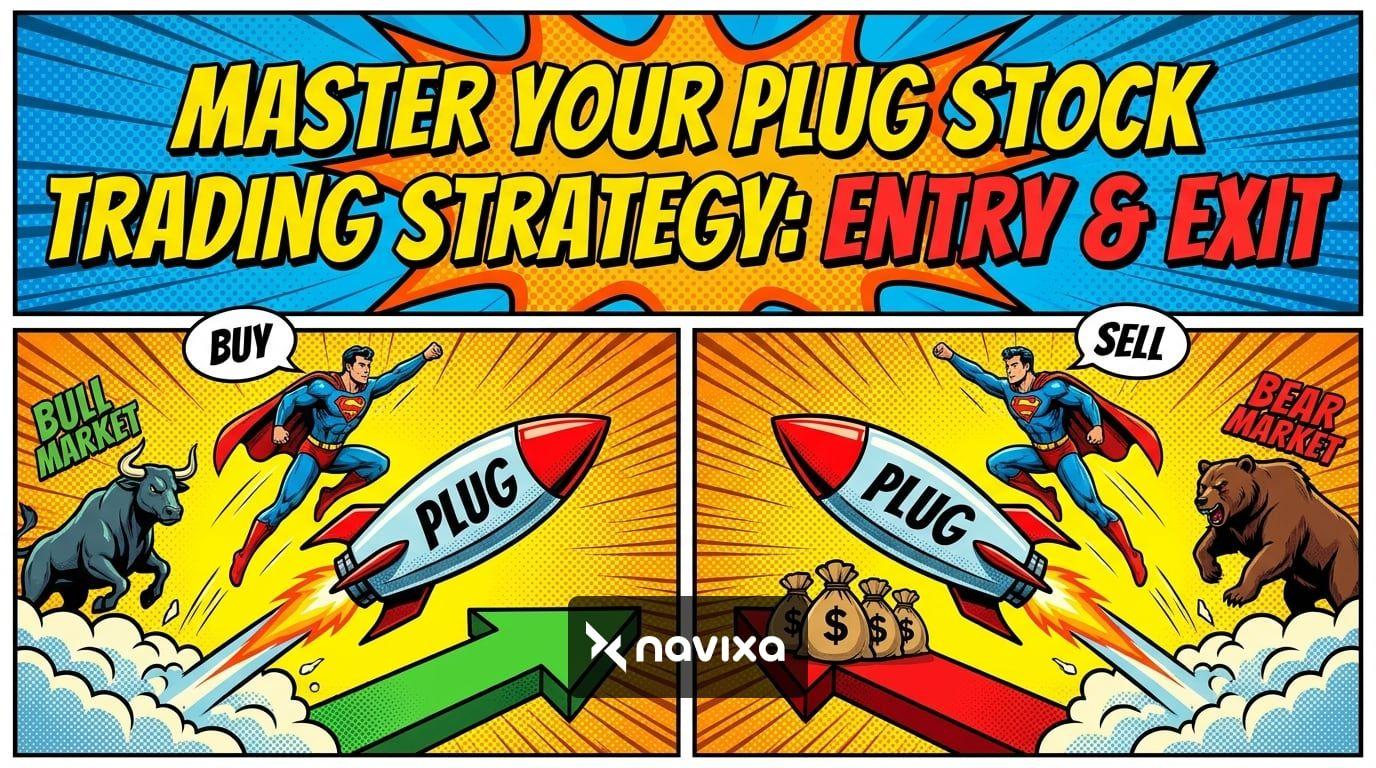
Master Your PLUG Stock Trading Strategy: Entry & Exit
- May 12, 2026
- 11 min read
The hydrogen energy sector is notorious for its dramatic price swings, making it both a challenging and lucrative arena for active investors. Recently, Plug Power (PLUG) delivered a first-quarter earnings report that caught Wall Street's attention, posting a 22% year-over-year revenue increase to $163.5 million and significantly improving its gross margins. This sudden injection of bullish momentum highlights the necessity of having a disciplined PLUG stock trading strategy.
With the stock hovering in the mid-$3 range and boasting a high beta of 2.06, wild intraday fluctuations are the standard. To succeed, traders must look beyond the green energy hype and rely on structured technical setups, clear fundamental catalysts, and ironclad risk management. Whether you are aiming to scalp intraday volatility or ride a multi-week swing trade, understanding the mechanics of this specific equity is your first step toward consistent execution.
- Plug Power's recent Q1 earnings beat and margin improvements provide a strong momentum catalyst.
- Establishing firm support and resistance levels prevents emotional trading during high-volatility sessions.
- A robust trading system combines macro fundamentals with precise technical indicators like the RSI and SMAs.
- Strict risk management and proper position sizing are mandatory due to the stock's beta exceeding 2.0.

The Macro Picture & Plug Power Fundamentals
Before diving into chart patterns, it is vital to understand the fundamental forces driving PLUG's price action. Plug Power is heavily invested in building an end-to-end green hydrogen ecosystem. In their recent Q1 report, management reaffirmed their goal to reach positive EBITDAS by the fourth quarter, a target that has become a battleground metric for bulls and bears alike.
Liquidity has been a historic concern for the company, but Plug recently reported ending the quarter with over $800 million in total cash, bolstered by expected asset monetization initiatives. When evaluating the broader market, risk-on appetite plays a significant role in how speculative tech and green energy stocks perform. For example, when high-risk assets like Bitcoin demonstrate resilience—recently holding strong above $81,000 despite warnings of equity corrections—it often signals a market environment willing to bid up growth sectors. Monitoring the broader macroeconomic market outlook is crucial, as shifts in interest rates or overall liquidity directly impact capital-intensive companies like Plug Power.
Market Analysis & Trading Psychology
Trading a high-beta stock requires a unique psychological approach. PLUG is not a slow-moving utility stock; it is an aggressively traded industrial tech equity capable of moving 15% to 20% in a single session following news catalysts. This extreme volatility can quickly drain a trader's emotional capital if they are unprepared.
Controlling the Emotional Pendulum
When a stock gaps up significantly on an earnings beat, the fear of missing out (FOMO) triggers an overwhelming urge to buy at the market open. Professional traders suppress this instinct. Instead of chasing a gap, they wait for the first initial pullback to establish a logical entry point. Maintaining emotional equilibrium means accepting that you will miss some moves. If PLUG surges past your planned entry zone without a proper setup, let it go. The market will always present another opportunity.
Furthermore, understanding the difference between a company's vision and its stock's reality is paramount. While Plug Power's mission to decarbonize global industries is noble, your job as a trader is to manage risk, not to blindly fund the green revolution. Detaching your personal beliefs about climate change from the cold, hard data on the chart is a hallmark of elite trading psychology.

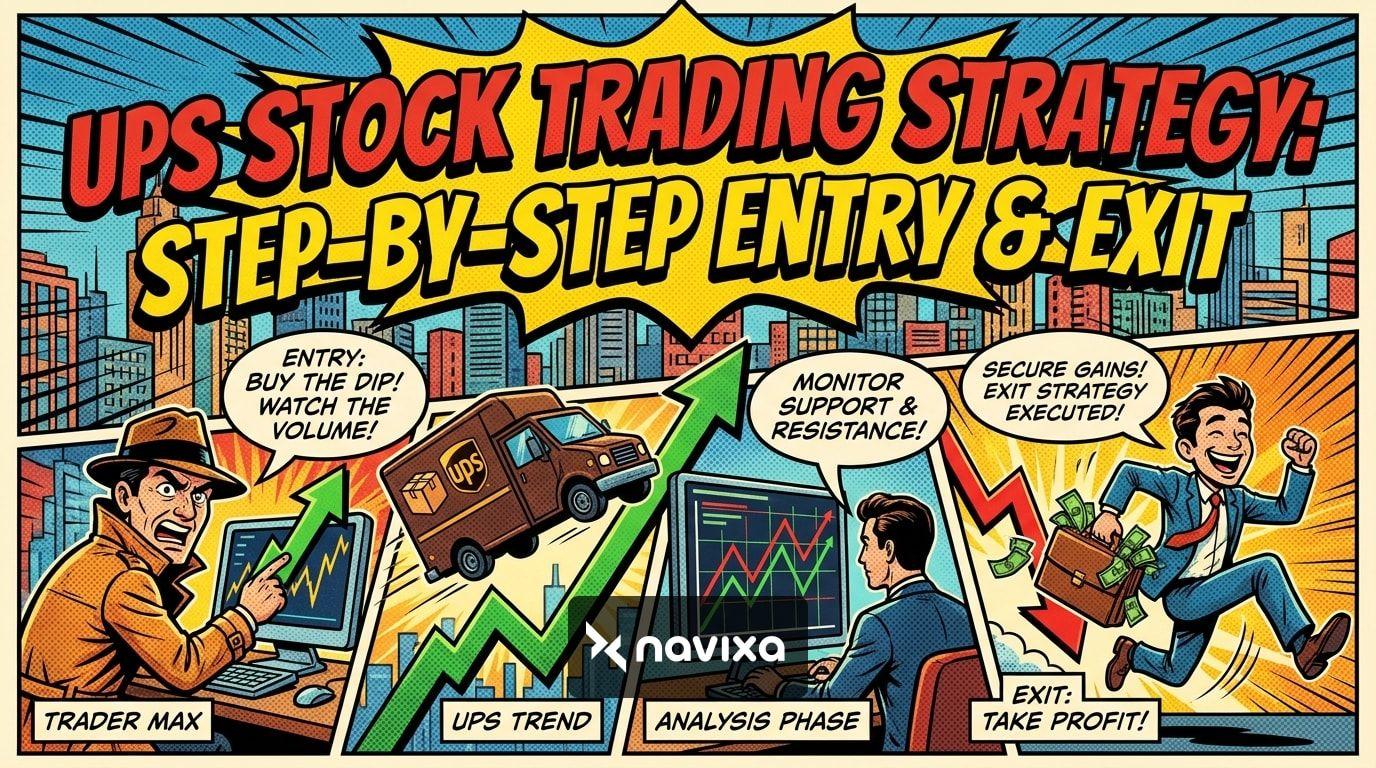
Developing a PLUG Stock Trading Strategy (Step-by-Step)
Building a reliable PLUG stock trading strategy requires blending trend identification with precise execution triggers. Because PLUG often experiences prolonged drawdowns followed by violent short-squeeze rallies, momentum indicators are your best friend.
Step 1: Moving Average Alignment
The first step is to analyze the Simple Moving Averages (SMAs). Recently, PLUG reclaimed its 20-day and 50-day SMAs, signaling a shift in short-term momentum. A golden rule for swing traders is to only initiate long positions when the stock price is holding firmly above the 50-day SMA. If the price breaks below this moving average on high volume, the bullish thesis is invalidated.
Step 2: Momentum Oscillators
Next, consult the Relative Strength Index (RSI). A 14-day RSI reading between 55 and 65 is ideal for entry, as it indicates strong momentum without the stock being dangerously overbought (which occurs above 70). Similar to the process of evaluating technical chart patterns in volatile crypto or tech assets, confirming momentum with volume is non-negotiable. An RSI breakout combined with volume that exceeds the 30-day average confirms institutional interest.
When trading high-beta stocks like PLUG, consider scaling into your position in quarters. This allows you to test the waters without exposing your entire capital to a sudden intraday reversal.
Step 3: Defining the Trade Timeframe
Your strategy will differ wildly depending on your holding period. Below is a breakdown of how day traders and swing traders approach PLUG differently.
| Feature | Day Trading PLUG | Swing Trading PLUG |
|---|---|---|
| Primary Indicators | VWAP, 5-min MACD, Level 2 Data | Daily SMAs (20/50), 14-day RSI, Volume Trends |
| Holding Period | Minutes to Hours | Days to Weeks |
| Profit Targets | 3% - 5% intraday moves | 15% - 25% structural resistance levels |
| Risk Tolerance | Tight stops below local VWAP | Wider stops below the daily 50 SMA |
For traders looking to automate their charting and streamline the identification of these setups, integrating a price action breakout strategy on your terminal can help spot forming wedges and ascending triangles before the broader market reacts.

Technical Analysis & Key Price Levels
Mapping out support and resistance is the cornerstone of any PLUG stock trading strategy. Due to the stock's historical price action, it tends to respect classic pivot points with remarkable accuracy.
When a stock experiences a massive historical decline from the $70s down to the sub-$1 range, technical overhead supply is heavy. This means that every major whole dollar mark ($3.00, $4.00, $5.00) acts as psychological resistance where trapped long-term investors look to break even and sell.
Currently, the critical support floor sits at the $2.92 to $3.05 zone. This area aligns with recent moving average clusters and serves as the ultimate line in the sand for bulls. On the upside, the classic R1 pivot rests near $3.65. A daily close above this level clears the path toward the R2 resistance zone at $4.17. Having a concrete step-by-step entry and exit plan before the market opens prevents you from making impulsive decisions when the stock tests these critical boundaries.
Risk Management Rules for PLUG
Risk management is not just a defensive tactic; it is the mathematical foundation of your survival in the market. Because Plug Power carries a beta of over 2.0, it is mathematically more than twice as volatile as the S&P 500. This requires strict adjustments to your standard portfolio risk parameters.
The 2% Rule
Never risk more than 2% of your total trading account equity on a single PLUG trade. If your account size is $10,000, your maximum allowed loss if your stop is hit should be $200. You calculate your position size by dividing that $200 by the distance between your entry price and your stop-loss price.
Stop-Loss Placement
Stop losses should be placed based on technical invalidation, not arbitrary dollar amounts. If you buy PLUG on a bounce off the 50-day SMA at $3.15, your stop loss should be placed slightly below the SMA, perhaps at $2.95, giving the trade room to breathe while capping catastrophic downside. Due to the inherent instability of the hydrogen sector's cash flows, utilizing a purely long-term value holding approach without dynamic hedging or trailing stops is incredibly risky.
Beware of overnight gap-down risks. Holding a heavily leveraged position in PLUG overnight exposes you to sudden sector downgrades or unexpected secondary stock offerings which can bypass your stop-loss orders entirely.

Conclusion
Successfully trading Plug Power requires a delicate balance of fundamental awareness and strict technical execution. By acknowledging the macroeconomic tailwinds supporting the hydrogen sector and pairing them with precise entry and exit parameters, you can navigate PLUG's extreme volatility with confidence.
Remember to define your timeframe, respect key technical levels like the 50-day SMA, and never compromise on your risk management rules. To further refine your approach and discover automated setups tailored for volatile markets, explore Navixa trading strategies and equip yourself with the tools needed to maintain a statistical edge. Always verify your thesis against Plug Power's official SEC filings and utilize robust platforms like TradingView's advanced charting tools to track real-time price action.
Frequently Asked Questions
What makes PLUG stock so volatile?
Plug Power operates in the emerging green hydrogen sector, which requires massive capital expenditure and relies heavily on government subsidies and long-term tech adoption. This speculative nature, combined with a history of cash burn and high retail trader interest, results in extreme price volatility and a beta significantly higher than the broader market.
Is PLUG better suited for day trading or swing trading?
PLUG can be lucrative for both, but the approach differs. Day traders capitalize on its high daily volume and 5-10% intraday ranges using the VWAP indicator. Swing traders tend to have better success buying during multi-week consolidations near major moving averages and holding for larger breakout moves.
How does the broader market affect a PLUG stock trading strategy?
Like most unprofitable tech and clean energy stocks, PLUG is highly sensitive to interest rates and macroeconomic liquidity. When rates are high or rising, capital rotates out of speculative growth stocks, pushing PLUG's price down. Conversely, a risk-on environment lifts the stock regardless of its immediate earnings performance.
Where should I place my stop loss when trading PLUG?
A standard practice is to place stop losses just below major moving averages (like the 20-day or 50-day SMA) or below the most recent structural swing low. This ensures you exit the trade only if the technical trend is actually broken, rather than getting shaken out by normal daily noise.