Introduction to META Market Dynamics
When analyzing mega-cap tech giants, Meta Platforms Inc. consistently presents one of the most dynamic charts for active traders and long-term investors alike. After achieving staggering all-time highs, navigating the subsequent volatility requires more than just reading earnings reports; it demands rigorous META stock technical analysis. Whether you are transitioning from the fast-paced world of cryptocurrency trading to traditional equities or you are a seasoned stock market veteran, understanding the key chart patterns driving Meta's price action is non-negotiable.
In recent times, Meta's stock has undergone wild fluctuations, heavily influenced by its massive capital expenditures in artificial intelligence and ongoing investments in digital ecosystems. This high-beta behavior creates a fertile environment for technical traders looking to capitalize on price inefficiencies. By stripping away the macroeconomic noise and focusing purely on price action, volume, and momentum indicators, traders can build a high-probability roadmap for their investments and mitigate severe portfolio drawdowns.
Current META Price Action: A Technical Overview
As of recent market sessions, Meta's stock has experienced a significant retracement from its historical 52-week peak of roughly $796. Currently hovering in the mid-$590 to $600 range, the asset is testing the resolve of both retail and institutional buyers. This substantial drawdown from its absolute peak places META in a classic consolidation phase, and potentially a broader trend reversal if critical support zones fail to hold.
When evaluating the primary momentum oscillators, the Relative Strength Index (RSI) on the daily chart sits near 37. This reading is technically neutral but leans heavily toward oversold territory. For traders accustomed to volatile markets, an RSI in this zone often precedes a relief rally, provided broader market conditions cooperate. However, the Moving Average Convergence Divergence (MACD) indicator paints a more cautious picture. The MACD line recently crossed below the signal line, confirming strong bearish momentum in the near term. This divergence between an approaching oversold RSI and a bearish MACD suggests that while downside velocity may slow, the path of least resistance currently remains downward.
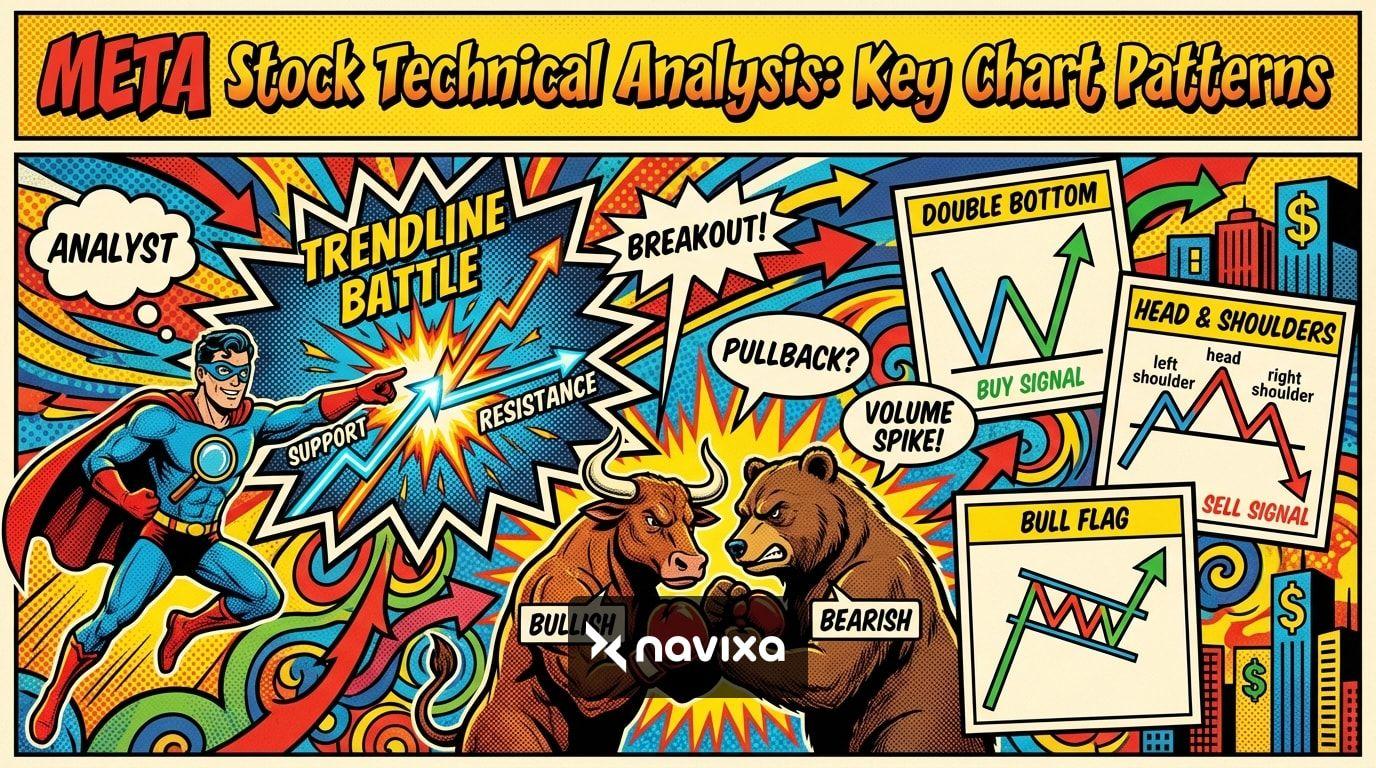
Unpacking the Key Chart Patterns
In META stock technical analysis, identifying the geometric formations on the chart provides actionable entry and exit parameters. Recently, Meta's price action has carved out several distinct patterns that traders must monitor rigorously.
The Converging Triangle Breakdown
One of the most prominent formations observed recently is a converging triangle, or symmetrical wedge. By connecting the lower highs from late last year into the early months of this year, and pairing them with the higher lows established during the same period, a clear convergence zone emerged. In technical trading, a break of this apex dictates the next major directional move.
Unfortunately for bulls, META recently broke below the lower boundary of this triangular area. A breakdown of this magnitude is historically a negative signal, often triggering algorithm-driven selling. For traders, this breakdown invalidates immediate bullish continuation setups and pivots the focus toward shorting lower highs or waiting for deeper structural support to formulate.
Moving Average Alignments
Another crucial element of our META stock technical analysis involves moving averages. The 50-day moving average, a staple for mid-term trend identification, is currently being pressured by the stock's recent decline. When a stock's price falls below the 50-day moving average, it typically shifts institutional sentiment from accumulation to distribution.
Furthermore, traders are closely watching the spread between the 50-day and the 200-day moving averages. While the 200-day moving average remains a foundational bedrock for the long-term bullish thesis, any potential "Death Cross" (where the 50-day crosses below the 200-day) would serve as a severe bearish confirmation that could trigger a prolonged downtrend.
Volume Analysis: The Silent Confirming Indicator
No technical analysis guide is complete without a deep dive into trading volume. Volume acts as the lie detector for price action. During Meta's ascent to its all-time high, the up days were consistently accompanied by above-average volume, signaling strong institutional accumulation. Mutual funds, hedge funds, and algorithmic trading desks were heavily buying the stock, reinforcing the bullish trend.
However, during the recent retracement, the volume profile has shifted. The breakdown below the converging triangle was marked by a spike in selling volume, validating the bearish move. If a stock falls on low volume, traders might dismiss it as a mere algorithmic liquidity hunt. But a breakdown on high volume indicates structural distribution.
Moving forward, traders should keep a close eye on the volume bars when META approaches crucial support zones. For a bullish reversal to be trustworthy, any bounce off the floor must be accompanied by a massive surge in buying volume, dwarfing the average daily volume of roughly 13.5 million shares.
Crucial Support and Resistance Levels
In any trading strategy, defining support (where buyers are expected to step in) and resistance (where sellers take control) is paramount. Meta's recent price depreciation has fundamentally altered its short-term and long-term supply/demand zones.
Immediate and Long-Term Resistance
Following the breakdown from the converging triangle, previous support levels have officially flipped into resistance. The $615 level, which previously served as a robust long-term support line, has been decisively broken. In technical analysis, broken support becomes new resistance. Therefore, any relief rally will likely face intense selling pressure at the $615 mark. Above that, the $648 and $665 levels represent secondary and tertiary resistance zones. Bulls will need substantial volume, potentially driven by a macroeconomic catalyst or an unexpected corporate announcement, to reclaim these levels.
Critical Support Zones
On the downside, the technical landscape is somewhat precarious. The immediate short-term support rests near the $549 level. Because the stock is currently trading in the $590s, there is a relatively wide air pocket between the current price and this next logical floor. If the $549 support fails to hold, the psychological $500 barrier comes into play. For technical traders, the $549 mark represents a high-probability zone for a swing trade entry, provided candlestick reversal patterns (such as a bullish engulfing or hammer) manifest upon testing the level.
Fundamental vs. Technical Convergence
While this guide focuses on META stock technical analysis, the most successful traders blend chart reading with underlying fundamental catalysts. Meta is currently in a unique transitional phase. The company's core advertising revenue remains an absolute juggernaut, boasting robust year-over-year growth. However, corporate leadership has aggressively committed billions of dollars toward artificial intelligence infrastructure. For traders with a background in cryptocurrency, Meta's Web3 and Metaverse ambitions remain a fascinating subplot impacting capital expenditure.
Let's compare the technical signals with fundamental factors currently influencing Meta.
| Metric / Indicator | Technical Analysis Viewpoint | Fundamental Analysis Counterpart |
|---|---|---|
| Price Trend | Bearish breakdown from converging triangle. | High CapEx on AI causing short-term investor hesitation. |
| MACD / Momentum | Bearish cross below the signal line. | Consistent revenue growth, but margins compressed by spending. |
| RSI (Relative Strength) | ~37 (Approaching Oversold conditions). | Institutional accumulation metrics showing slight distribution. |
| Key Levels | Strong resistance at $615, support at $549. | Valuation limits based on Forward P/E ratios and macro interest rates. |
Actionable Trading Strategies for META
Armed with an understanding of key chart patterns and vital price levels, how can traders capitalize on Meta's current market dynamics? Here are sophisticated strategies to consider.
Options Trading and the Expected Move
For traders looking to leverage volatility without outright equity exposure, the options market provides deep insights. Options pricing models calculate an "expected move" based on implied volatility. Recently, short-term options have priced in an expected move of roughly ±$10 (or ~1.6%) on a weekly basis.
Traders can use this statistical probability to their advantage. For instance, employing an Iron Condor strategy allows you to collect premium if you believe META will consolidate and remain within a tight range (e.g., between $580 and $610). Conversely, if you expect a violent breakdown past the $549 support, purchasing put options with a delta of -0.30 provides asymmetric downside capture while strictly defining your risk.
Swing Trading the Consolidation Zones
If you prefer trading the underlying equity, the current technical setup demands a patient, level-to-level approach. A classic swing trading strategy here involves waiting for a retest of the broken $615 level. If the price touches $615 and prints a bearish rejection candle on the daily timeframe, it presents a textbook short-entry opportunity, with a stop-loss placed tightly above $620 and a profit target set near the $549 support.
Alternatively, a long-biased swing trader should practice immense patience. Buying in the middle of a downtrend offers a poor risk-to-reward ratio. The optimal play is waiting for a capitulation wick down to the $549 support level, verifying oversold RSI conditions (below 30), and executing a long position targeting a mean reversion bounce.
Risk Management and Market Correlation
Advanced META stock technical analysis is useless without stringent risk management. Meta Platforms is a high-beta technology stock. Its price action is heavily tethered to the broader Nasdaq 100 index and shifting macroeconomic narratives, particularly regarding interest rates and artificial intelligence infrastructure spending.
Traders with a background in cryptocurrency will recognize this volatility instantly. Just as Bitcoin can drag the entire altcoin market down with it, a massive sell-off in semiconductor stocks or cloud computing giants can drag Meta down, regardless of how bullish its individual chart might look.
"In trading, it is not about how much you make when you are right, but how much you protect when you are wrong."
To truly trade like a professional, one must implement advanced position sizing techniques. Because Meta's daily expected move can be volatile, assigning a static dollar amount to every trade is a recipe for disaster. Instead, calculate the distance between your entry point and your stop-loss level, and adjust your share size so that a triggered stop results in exactly a 1% to 2% loss of your total equity. Furthermore, pay close attention to beta weighting and avoid over-leveraging into the tech sector.
Conclusion
Conducting thorough META stock technical analysis reveals a complex but highly tradeable landscape. The recent breakdown from the converging triangle and the loss of the $615 long-term support level dictate a cautious, defensively minded trading approach. However, within this volatility lies opportunity. By meticulously tracking the $549 support, monitoring RSI and MACD divergences, and employing disciplined risk management, traders can navigate Meta's price fluctuations with confidence. Always remember that chart patterns are probabilistic frameworks designed to give you an edge in an inherently unpredictable market.
Frequently Asked Questions
What does a broken support level mean for META stock?
When a stock like META drops below a significant support level, such as the recent $615 mark, it indicates that selling pressure has overwhelmed buying demand. In technical analysis, this broken support level flips to become a new resistance level. Traders often look to short the stock if it rallies back to this price and gets rejected by sellers.
How does the RSI indicator help in analyzing META?
The Relative Strength Index (RSI) is a momentum oscillator that measures the speed and change of price movements on a scale of 0 to 100. For META, an RSI near 37 leans toward oversold territory (which begins at 30). This tells traders that the stock has experienced significant selling pressure, and a short-term relief bounce might be approaching, although it is not guaranteed until bullish price action confirms it.
Can technical analysis predict META's exact future price?
No. Technical analysis is a study of probabilities, not certainties. While tools like moving averages, chart patterns, and expected options moves provide highly educated estimates of where the stock might find support or resistance, macroeconomic events, sudden earnings reports, or broad market crashes can completely override technical setups.
What is the significance of the converging triangle pattern?
A converging triangle (or symmetrical wedge) forms when a stock makes lower highs and higher lows, representing a period of market indecision and consolidation. The significance lies in the breakout or breakdown. META recently broke below this pattern, signaling that bears have taken control and confirming a short-to-mid-term downtrend.


