Introduction to Alphabet's Market Dynamics
Alphabet Inc. (NASDAQ: GOOG) remains one of the most closely watched equities in the global financial markets. As the tech behemoth transitions rapidly from a traditional search engine monopoly into a dominant artificial intelligence infrastructure powerhouse, its market dynamics are shifting. For traders and investors alike, relying solely on fundamental data is no longer enough to navigate the intraday and swing volatility of mega-cap tech stocks. This is where GOOG stock technical analysis becomes an essential tool for identifying key price trends, optimal entry points, and psychological market boundaries.
Historically, Alphabet has been a steady compounder, but recent developments—spanning massive capital expenditures in AI infrastructure to robust Google Cloud profitability—have introduced higher beta to the stock. In recent months, GOOG shares have experienced a volatile cycle, soaring to all-time highs near $350 before enduring a sharp correction toward the $273 level, and finally initiating a significant rebound back to the $295 region.
Understanding the technical structure behind these price movements allows traders to cut through the noise of daily news cycles. In this comprehensive guide, we will break down the crucial moving averages, momentum oscillators, volume profiles, and actionable trading strategies that are currently defining GOOG's price action.
The Macro Landscape: AI Investments vs. Market Expectations
Before diving into the pure technicals, it is vital to understand the macroeconomic and fundamental catalysts driving the charts. Technical analysis does not exist in a vacuum; the price action on the screen is a direct reflection of aggregate human emotion, institutional capital flows, and algorithm-driven algorithmic trading.
Alphabet is currently executing a massive "reset," shedding its old skin as merely a digital advertising firm to become an AI utility provider via Gemini 3.0, TurboQuant, and its Vertex AI platform. However, this transition comes at a steep cost. Alphabet's elevated capital expenditure (CapEx) guidance of $175 billion to $185 billion has sparked "CapEx trap" fears among institutional investors.
Despite these fears, Alphabet's underlying business remains highly robust, anchored by a Google Cloud services division boasting a $70 billion annual run rate. When the stock dipped violently below its medium-term averages, it highlighted a stark disconnect between fundamental strength and technical weakness—a setup that savvy technical traders often view as a prime opportunity.
"Technical analysis is not about predicting the future with absolute certainty; it is about probability management, risk mitigation, and understanding the psychological boundaries of market participants."
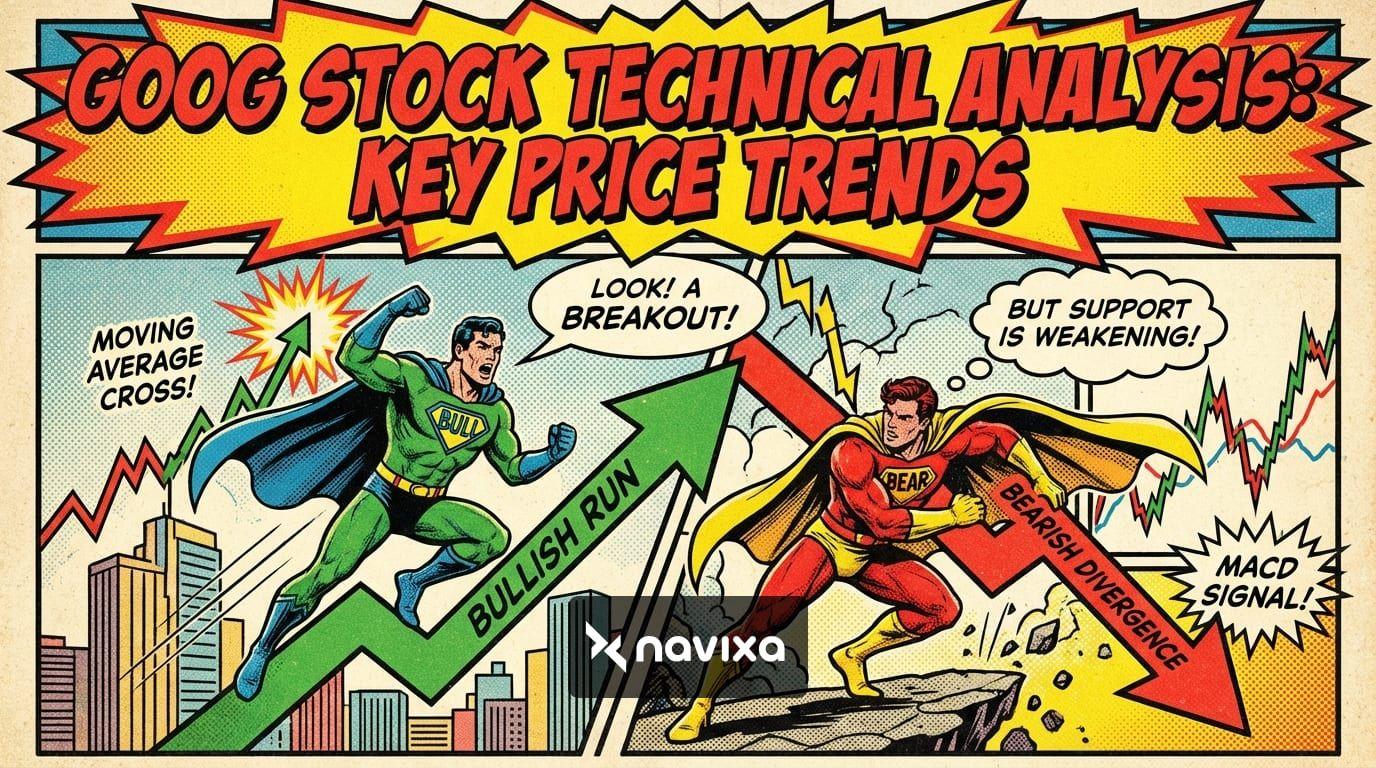
Core GOOG Stock Technical Analysis
To build a robust trading thesis, we must evaluate the core technical indicators that institutional algorithms and retail traders monitor daily. The confluence of these indicators provides a roadmap for GOOG's future price action.
Moving Averages: The 50-Day and 200-Day Battleground
Moving averages are the foundational building blocks of technical analysis, smoothing out daily price action to reveal broader trends. For GOOG stock, three specific Simple Moving Averages (SMAs) are telling a compelling story:
1. The 50-Day SMA (~$310): The 50-day SMA is widely regarded as the medium-term trend indicator. Currently, GOOG is trading below this level, which means the medium-term momentum leans bearish. The $310 to $315 zone is now acting as strong overhead resistance. For the bulls to regain complete control of the narrative, a high-volume daily close above the 50-day SMA is required. 2. The 100-Day SMA (~$311): Hovering just above the 50-day SMA, the 100-day SMA reinforces the resistance zone. When both the 50-day and 100-day converge, they create a "stacked resistance" band that is historically difficult to break without a major fundamental catalyst. 3. The 200-Day SMA (~$264 - $265): The 200-day SMA is the ultimate "line in the sand" for long-term investors. It separates a healthy market correction from a full-blown macroeconomic bear market. During the recent tech sector sell-off, GOOG plunged dangerously close to this level, bottoming out around $273 before aggressive institutional buying stepped in. The successful defense of the 200-day SMA confirms that the macro uptrend remains intact.
For more insights into how these averages interact, you can review TradingView's educational portal on Moving Averages.
Relative Strength Index (RSI): The Springboard Effect
The Relative Strength Index (RSI) measures the speed and change of price movements on a scale of 0 to 100. Traditionally, an asset is considered "oversold" below 30 and "overbought" above 70.
During its recent correction, GOOG's 14-day RSI plummeted to an astonishing 18.2. For a "Magnificent 7" mega-cap stock, an RSI reading below 20 is exceedingly rare and historically signals deep capitulation. In technical circles, this extreme oversold condition is often viewed as a "coiled spring."
When selling pressure reaches exhaustion at these sub-20 levels, it typically triggers a sharp relief rally—often referred to as mean reversion. True to form, the stock bounced aggressively from its lows, driving the RSI back into the neutral 40–60 territory. This upward momentum suggests that the worst of the short-term selling pressure has subsided.
To master momentum trading, studying resources like Investopedia's guide to the Relative Strength Index (RSI) is highly recommended.
MACD and Momentum Shifts
The Moving Average Convergence Divergence (MACD) is a trend-following momentum indicator that shows the relationship between two moving averages of a stock's price.
Following the violent drop to the $270s, the daily MACD histogram began to display shrinking red bars, indicating that downward velocity was decelerating. As the stock pushes back toward $295, traders are closely watching for a bullish MACD crossover—where the MACD line crosses above the signal line. A confirmed crossover on the daily chart would provide secondary validation that a new short-term uptrend is underway.
Volume Profiling and Options Market Activity
Price action without volume is like a car without an engine. Analyzing Alphabet's trading volume provides clues about institutional participation.
Alphabet shares typically see an average daily trading volume of 25 million to 35 million shares. During the capitulation drop toward $273, selling volume spiked dramatically, flushing out weak hands and over-leveraged retail traders. However, the subsequent rebound was accompanied by steady accumulation volume, suggesting that large funds and institutional buyers were stepping in to buy the dip near the 200-day SMA.
Furthermore, the options market provides insights into expected volatility. Options pricing models calculate the "Expected Move" of a stock heading into key events, such as earnings calls. With Alphabet's Q1 earnings reports always acting as massive liquidity events, options traders often price in implied volatility swings of ±3% to ±5%. Traders use these expected move boundaries to sell premium outside the expected range or to structure advanced risk-defined trades like iron condors and butterfly spreads.
Comparison: Key Technical Levels
To simplify the technical landscape, we have isolated the most critical support and resistance zones. Watching how GOOG stock interacts with these levels will dictate short-to-medium-term trading strategies.
| Support/Resistance Level | Price Target | Technical Significance |
|---|---|---|
| Resistance 2 | $350.00 | 52-Week High & Major Psychological Barrier |
| Resistance 1 | $310.00 - $315.00 | 50-Day SMA & Pre-Earnings Gap Fill Target Zone |
| Current Price Area | ~$295.00 | Near-Term Mean Reversion & Consolidation Level |
| Support 1 | $273.00 | Recent Oversold Swing Low (Capitulation Point) |
| Support 2 | $264.00 | 200-Day Simple Moving Average (Macro Support) |
Actionable Trading Strategies for GOOG
Based on the current GOOG stock technical analysis, market participants can deploy several different strategies depending on their time horizon and risk tolerance.
Strategy 1: The Mean Reversion Swing Trade
With the stock having bounced from its heavily oversold RSI levels, the immediate technical objective is a return to the mean. In this case, the "mean" is represented by the 50-day SMA sitting around the $310 to $315 zone.
* Entry: Accumulate positions in the $290 to $295 range during intraday market dips. * Target: Sell into strength as the stock approaches the $310-$315 resistance cluster. * Stop-Loss: Place a hard stop just below the recent swing low of $273 to protect capital against unexpected macroeconomic shocks.
This strategy capitalizes on the historical tendency for stock prices to run up in anticipation of quarterly earnings calls, driven by short-covering and speculative buying.
Strategy 2: Macro Support Accumulation (Long-Term)
For investors with a multi-year time horizon who are bullish on Alphabet's AI and Cloud infrastructure transition, the technical charts offer a clear accumulation zone.
* Entry: Use a dollar-cost averaging (DCA) approach to buy shares aggressively anytime the price drops within 5% of the 200-day SMA ($264 - $275). * Rationale: The 200-day moving average is heavily defended by algorithmic trading bots and large institutional portfolios. Buying near this level provides a highly favorable risk-to-reward ratio. * Risk Management: If the stock breaks and closes below the 200-day SMA on high weekly volume, it signals a structural trend change, prompting a reassessment of the long-term thesis.
Risk Management Protocols
No technical setup, no matter how favorable, is immune to risk. A disciplined approach to risk management is what separates professional traders from gamblers.
* Position Sizing: Never allocate more than 3% to 5% of your total trading portfolio to a single directional swing trade. This prevents catastrophic drawdowns if a trade goes against you. * Sector Correlation: Keep an eye on broader indices like the Nasdaq 100 (NDX) and the Communication Services Select Sector SPDR Fund (XLC). GOOG is heavily weighted in these funds; if the broader market sells off due to interest rate fears or geopolitical tensions, Alphabet will likely be dragged down regardless of its individual technical setup. * Catalyst Awareness: Technicals dictate the boundaries, but fundamentals break them. Be acutely aware of upcoming macroeconomic data releases (CPI, Fed rate decisions) and Alphabet's scheduled earnings dates, as these events can cause massive gap-ups or gap-downs that bypass traditional stop-loss orders.
Practical Takeaways
To summarize the current technical environment for GOOG stock:
* The Trend is Shifting: While medium-term momentum remains pressured below the 50-day SMA, the successful test and defense of the 200-day SMA confirm the long-term bullish trend is intact. * Oversold Conditions Triggered a Bounce: The historical RSI dip below 20 created a massive coiled spring effect, initiating the current recovery phase. * Resistance is Clear: Bulls face a tough battle at the $310-$315 level. A breakout above this zone is required to target the $350 all-time highs. * AI and Cloud are Key: Technical analysis must be paired with fundamental awareness of Alphabet's $70B Cloud run rate and AI CapEx spending to understand the "why" behind the price action.
Conclusion
Conducting a thorough GOOG stock technical analysis reveals a compelling narrative of a tech giant caught between immense capital transition and resilient market support. The recent drop to the $270s tested the conviction of long-term holders, but the subsequent defense of the 200-day SMA has provided a clear technical foundation. As GOOG works off its historically oversold RSI levels and targets a mean reversion toward its 50-day moving average, traders are presented with clearly defined risk-to-reward setups.
Whether you are a short-term swing trader looking to capitalize on pre-earnings momentum or a long-term investor scaling in near macro support, respecting these key technical levels is paramount. Always implement strict risk management, stay informed on macroeconomic catalysts, and let the charts guide your capital allocation.
***
Frequently Asked Questions
What is the current critical support level for GOOG stock?
The most critical long-term support level for GOOG stock is its 200-day Simple Moving Average (SMA), which currently sits in the $264 to $265 range. A decisive drop below this line often signals a shift from a temporary correction into a broader bearish trend.
How does the Relative Strength Index (RSI) impact GOOG's price action?
The RSI measures momentum and helps identify overbought or oversold conditions. Recently, GOOG's RSI dropped to an extreme low of 18.2. In technical analysis, an RSI below 30 indicates that a stock is heavily oversold, often trapping short-sellers and triggering a "relief rally" or mean reversion upward as buying pressure returns.
When is Alphabet's next major fundamental catalyst?
Earnings reports act as massive catalysts that can invalidate or accelerate technical trends. Alphabet's quarterly earnings calls—which provide vital updates on Google Cloud revenue, AI capital expenditures, and advertising growth—are the primary fundamental drivers that traders must watch. Price action typically experiences heightened volatility in the days leading up to and immediately following these reports.
Can macroeconomic factors override GOOG's technical setup?
Absolutely. While technical analysis provides excellent support and resistance mapping, macroeconomic factors such as unexpected Federal Reserve interest rate hikes, inflation data (CPI), or geopolitical tensions can cause systemic market sell-offs. In such scenarios, algorithmic sector-wide selling can cause GOOG to slice through technical support levels regardless of its individual chart setup.


