Introduction
The digital asset ecosystem is a fast-paced environment where market sentiment, institutional flows, and macroeconomic factors collide. For traders navigating this complex landscape, XRP technical analysis serves as a vital compass. As one of the most prominent cryptocurrencies, XRP presents a unique trading vehicle. Historically characterized by its distinct market cycles and significant legal narratives, the token requires a specialized approach to price action and chart patterns.
Recently, the joint classification of XRP as a digital commodity by the SEC and CFTC, coupled with the introduction of legislative frameworks like the CLARITY Act, has shifted the fundamental backdrop. With spot XRP ETFs drawing substantial assets under management, institutional capital is gradually altering the token's market structure. However, fundamental developments only tell half the story. To perfectly time entries, optimize exits, and rigorously manage risk, mastering technical analysis is non-negotiable.
This comprehensive guide delves into the core components of XRP technical analysis, from reading raw price action and interpreting essential chart patterns to leveraging advanced indicators. Whether you are a day trader looking to capitalize on intraday volatility or a swing trader targeting broader macro trends, these actionable insights will refine your trading edge and elevate your market perspective.
Decoding XRP Price Action: The Market Dynamics
Price action is the rawest form of technical data. It strips away the noise of lagging indicators and focuses entirely on how price reacts to critical support and resistance zones. For XRP, price action is historically characterized by prolonged periods of consolidation punctuated by explosive, high-volume breakouts.
Identifying Key Support and Resistance Zones
Support and resistance are the foundational pillars of XRP technical analysis. They represent psychological and structural battlegrounds where buyers and sellers clash.
In contemporary market cycles, XRP frequently establishes formidable support floors during corrections—often found in the $1.30 to $1.32 range depending on current ranges. This zone frequently acts as a springboard, where institutional accumulation and retail demand absorb prevailing selling pressure. Conversely, resistance levels represent overhead supply where previous buyers look to take profits. By mapping these pivotal zones on a daily or weekly timeframe, traders can identify high-probability reversal or breakout areas with impressive accuracy.
The Impact of Trading Volume on Price Action
Volume is the ultimate validator of price action. An upward move accompanied by exceptionally low trading volume often signals a lack of conviction, making it susceptible to becoming a "bull trap." Alternatively, when XRP breaks through a critical resistance level on expanding volume—often exceeding its multi-billion daily average—it indicates strong institutional participation and a much higher probability of trend continuation. Analyzing the direct relationship between candlestick spreads and volume spikes is absolutely crucial for validating genuine market momentum.
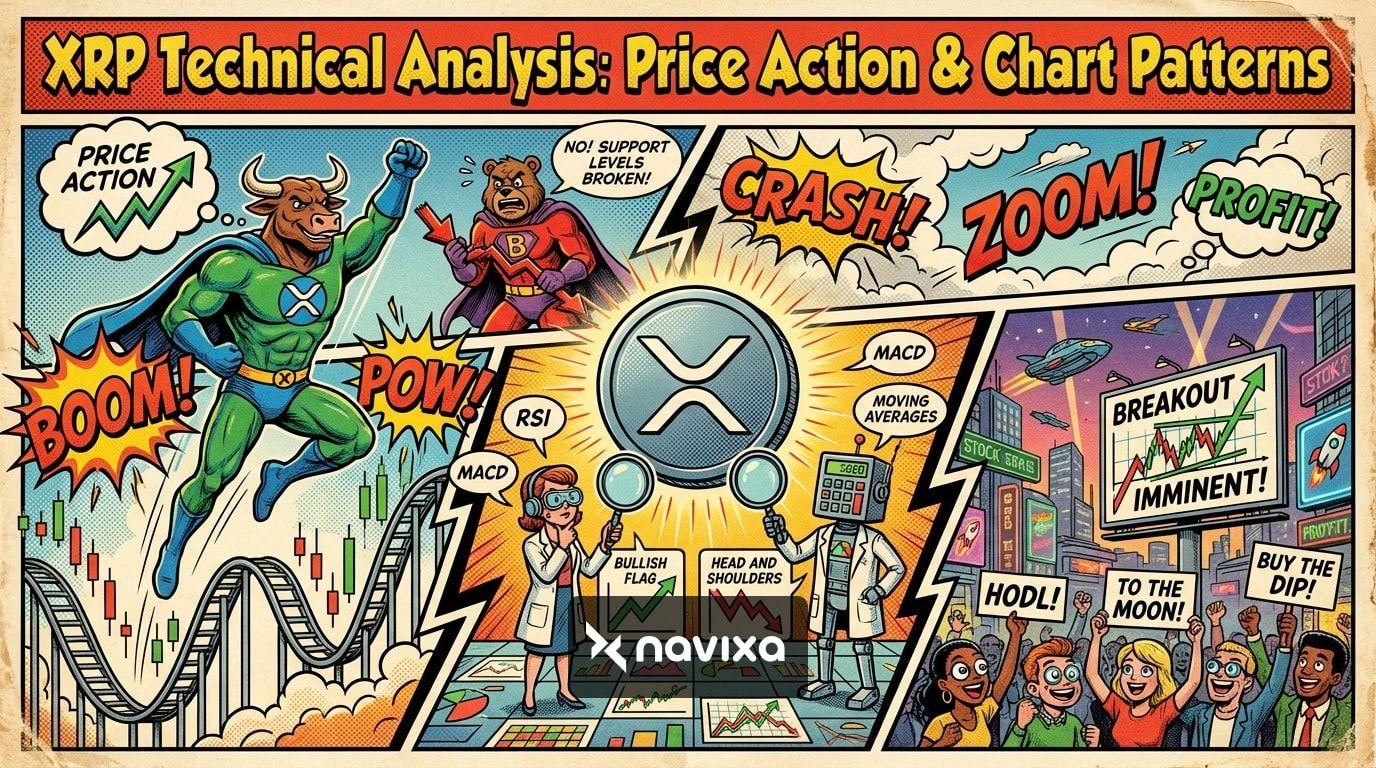
Essential Chart Patterns in XRP Technical Analysis
Chart patterns are visual representations of prevailing market psychology. Over the years, XRP has repeatedly formed specific geometric patterns that provide excellent clues about future price direction. Recognizing these formations early allows proactive traders to position themselves advantageously.
Symmetrical Triangles and Consolidation Breakouts
Symmetrical triangles are among the most common and reliable patterns in XRP's long trading history. They occur when price action compresses into an increasingly tighter range, visually characterized by lower highs and higher lows. This compression indicates equilibrium between buyers and sellers, building up potential kinetic energy for a massive directional move.
When conducting XRP technical analysis, professional traders strictly watch for a decisive daily close completely outside the triangle's boundaries. A breakout to the upside, strongly supported by rising volume, often initiates a prolonged bullish leg. Conversely, a breakdown below the lower trendline suggests a painful continuation of a bearish trend.
Bull Flags and Descending Channels
Trend continuation patterns, such as bull flags, are vital for traders looking to enter a heavily established trend safely. After an explosive move upward, XRP frequently enters a brief consolidation phase, forming a downward-sloping parallel channel. This specific channel, or "flag," primarily represents healthy profit-taking. A breakout above the upper trendline signals the aggressive resumption of the primary uptrend.
Monitoring descending channels is essential during cooling-off periods. When XRP trades below major moving averages in a descending channel, traders must exercise extreme caution. It is usually best to wait for a structural break of the channel's upper resistance before committing heavy capital to new long positions.
Head and Shoulders Formations
The Head and Shoulders pattern—and its inverse counterpart—are incredibly powerful reversal indicators. A standard Head and Shoulders appearing at the euphoric peak of a bull run signals exhaustion and an impending macroeconomic downtrend. An Inverse Head and Shoulders at the bottom of a prolonged bear market suggests total seller capitulation and the birth of a brand-new uptrend. Identifying the critical "neckline" of these patterns provides an exact trigger for executing profitable reversal trades.
Technical Indicators: Building a Robust Strategy
While price action directly provides the architectural framework, technical indicators offer granular, mathematical insights into momentum, trend strength, and potential reversal zones. A robust XRP technical analysis strategy seamlessly combines multiple indicators to form an undeniable confluence of signals.
Moving Averages and the "Death Stack"
Moving Averages (MAs) smooth out erratic price data to reveal the underlying trend direction. The 50-day and 200-day Exponential Moving Averages (EMAs) are particularly crucial across all digital assets. A "Golden Cross," where the 50-day EMA firmly crosses above the 200-day EMA, is a heavily monitored bullish signal that often attracts algorithm-driven buying.
However, traders must also quickly recognize bearish setups, such as the infamous "Death Stack." This frustrating setup occurs when the token's price trades below the 7-day, 14-day, and 30-day moving averages, which are sequentially stacked directly above the price. Overcoming a Death Stack usually requires a significant macro catalyst, making it a clear technical warning to avoid premature long positions.
Relative Strength Index (RSI) and Money Flow Index (MFI)
The RSI is a leading momentum oscillator that measures the speed and change of price movements, permanently fluctuating between a scale of 0 and 100. In XRP technical analysis, an RSI dropping below 30 typically indicates an oversold condition, while an RSI shooting above 70 suggests an overbought, frothy market.
To significantly refine this metric, advanced traders incorporate the Money Flow Index (MFI), which intelligently blends price momentum with trading volume. If XRP experiences a harsh pullback and the MFI drops near the 30-35 level, it implies that selling pressure is rapidly exhausting and a relief rally or structural bounce is statistically probable.
Fibonacci Retracement Levels
Fibonacci retracements are essentially indispensable for successfully identifying hidden support and resistance levels during a strongly trending market. By connecting a definite cycle low to a major cycle high, traders can accurately project potential pullback targets. For XRP, the 0.382 and 0.618 (often dubbed the "Golden Pocket") retracement levels are incredibly respected by market making algorithms. Traders often confidently place buy limit orders within the Golden Pocket during temporary corrections, anticipating a strong bounce.
If you are entirely new to incorporating these specialized metrics, you can easily learn more about general charting principles from comprehensive financial resources like Investopedia's Technical Analysis Guide.
Actionable Trading Strategies for XRP
Knowledge of patterns and indicators is only mathematically profitable when faithfully translated into an actionable trading strategy. Here are several proven frameworks explicitly tailored for XRP's unique market behavior.
Range Trading the Consolidation
Because XRP often spends long, grueling months in tight consolidation, range trading is a highly effective, low-stress strategy. This actively involves identifying the absolute floor (support) and ceiling (resistance) of the current market structure. Traders confidently execute long positions near support boundaries and short positions (or aggressively take profits) near resistance. The critical key to range trading is strict discipline—exiting the trade immediately if the price decisively breaches the outlined support or resistance boundaries.
Breakout and Retest Strategy
For more aggressive momentum traders, the breakout strategy is heavily favored. Instead of blindly predicting the breakout direction, traders patiently wait for XRP to pierce a major resistance level. However, buying the initial breakout candle can be extremely risky due to frequent market "fake-outs." A definitively safer approach is the "Breakout and Retest" methodology. Once XRP breaks resistance, it frequently returns to retest that exact level, effectively turning old resistance into newly minted support. Entering on the successful retest offers a vastly superior risk-to-reward ratio.
Trading the News vs. Trading the Chart
XRP is uniquely hyper-sensitive to global regulatory developments and traditional institutional adoption news. A robust, modern trading plan constantly aligns XRP technical analysis with fundamental catalysts. For instance, positive legislative developments or consistently massive spot ETF inflows can easily provide the sudden volume needed to shatter stubborn technical resistance. Smart traders keep a constant eye on global market aggregators like CoinMarketCap to closely monitor the live volume spikes that typically accompany breaking news.
Comparing Technical Indicators for XRP Trading
To methodically build an optimal charting setup, it is immensely helpful to understand how different indicators specifically perform under XRP's distinct market conditions. The following comparison table highlights the most widely utilized tools.
| Technical Indicator | Primary Use Case | XRP Specific Reliability | Best Timeframe |
|---|---|---|---|
| RSI (Relative Strength Index) | Identifying overbought/oversold extremes | High (respects 30/70 levels well) | 4H, Daily |
| MFI (Money Flow Index) | Gauging volume-weighted capital flow | Very High (vital for volume validation) | Daily |
| MACD (Moving Average Convergence) | Spotting momentum shifts and trend reversals | Moderate (can lag during sudden news spikes) | Daily, Weekly |
| Fibonacci Retracements | Predicting pullback zones in a trend | High (Golden Pocket is a frequent bounce area) | 1H, 4H, Daily |
| Bollinger Bands | Measuring volatility and range compression | High (excellent for spotting impending breakouts) | 4H, Daily |
Risk Management: Protecting Your Capital
Absolutely no amount of elite XRP technical analysis can realistically guarantee a 100% win rate. The absolute true secret to lasting longevity in cryptocurrency trading is stringent, unwavering risk management. The crypto markets are inherently volatile, and XRP is fundamentally no exception to these massive swings.
Strategic Stop-Loss Placement
A predetermined stop-loss order is your absolute final line of defense against violently adverse market movements. When actively trading XRP, explicitly avoid placing stop-losses exactly at obvious, round psychological numbers (e.g., exactly $1.30 or $1.00), as predatory market makers often actively "hunt" these dense liquidity pools. Instead, purposely place your stop-loss slightly below the actual structural support levels or just outside the defined boundaries of a major trendline to avoid unnecessary liquidations.
Position Sizing and Leverage
As a golden rule, never risk more than 1% to 2% of your total trading portfolio balance on a single XRP trade setup. Proper mathematical position sizing effectively ensures that a sudden string of consecutive losses will not permanently deplete your working capital. Furthermore, while utilizing leverage can magnificently amplify profits, it simultaneously magnifies devastating losses. In a uniquely regulatory-sensitive asset class like XRP, sudden headline-driven volatility spikes can cause rapid liquidations. Use leverage sparingly, and strictly only when a trade setup possesses a massive, undeniable confluence of supporting technical indicators.
Practical Takeaways for Crypto Traders
To seamlessly and effectively integrate these advanced concepts into your daily trading routine, consistently keep the following highly practical takeaways in mind:
1. Always Validate with Volume: A beautiful chart pattern breakout is genuinely only as strong as the trading volume behind it. Ignore low-volume, suspicious moves. 2. Respect the Macro Trend: Do not foolishly try to catch falling knives during a major structural downtrend. Wait for the moving averages to visibly flatten and cross upward. 3. Monitor the MFI closely: Keep a close eye on the Money Flow Index. When it aggressively dips near 30, begin to eagerly prepare for potential accumulation opportunities. 4. Blend Fundamentals and Technicals: Use technical analysis to expertly time your specific entry, but rely heavily on the macroeconomic and regulatory environment to dictate your overall market bias.
Conclusion
Mastering XRP technical analysis ultimately empowers everyday traders to rapidly decode the noisy chaos of the market and make highly logical, data-driven financial decisions. By deeply understanding the subtle nuances of price action, seamlessly recognizing historical chart patterns, and intelligently utilizing a robust suite of technical indicators, you can navigate XRP's legendary volatility with total confidence.
Remember, consistently successful trading is never about flawlessly predicting the future with absolute, magical certainty; it is entirely about identifying highly asymmetrical risk-to-reward opportunities and successfully executing them with utterly disciplined risk management. Equip your live charts, rigorously analyze the prevailing market volume, greatly respect the vital support zones, and never let raw emotion override your established technical strategy. Start actively applying these proven frameworks to your daily trading setups today, and permanently elevate your approach to the highly lucrative cryptocurrency markets.
Frequently Asked Questions
Why is XRP technical analysis different from Bitcoin?
While Bitcoin routinely dictates the broader macroeconomic crypto trend, XRP is heavily influenced by its distinct institutional payment use cases and a highly complex regulatory history. This uniquely means XRP can often experience extended periods of flat consolidation entirely decoupled from Bitcoin's price, immediately followed by massive, sudden vertical breakouts driven by specific fundamental or legal catalysts.
How do regulatory news events impact XRP chart patterns?
Major regulatory developments—such as positive ETF approvals, massive institutional inflows, or legislative clarity like the CLARITY Act—act as fundamental volume triggers. These massive events can instantly and entirely invalidate bearish technical setups or violently accelerate a bullish breakout. Technical traders intelligently use these anticipated news events to foresee the massive volume required to rapidly push the price directly through major historical resistance levels.
What timeframe is best for analyzing XRP price action?
The absolute best timeframe heavily depends on your specific trading style. Fast-paced day traders rely heavily on the 15-minute and 1-hour charts to rapidly capture intraday volatility. Conversely, patient swing traders and long-term investors should strictly prioritize the 4-hour, Daily, and Weekly charts, as these higher timeframes perfectly filter out chaotic intraday noise and reliably provide a much clearer, actionable picture of the true macro trend and major structural support/resistance zones.
How reliable are moving averages for XRP trading?
Moving averages are generally highly reliable for accurately determining the overall long-term trend of XRP, particularly the revered 50-day and 200-day EMAs. However, because XRP has a historical tendency to consolidate tightly for many consecutive months, moving averages may flatten and painfully cross each other repeatedly (a term known as whipsawing). Therefore, for maximum safety, they should absolutely always be combined with volume indicators and momentum oscillators for reliable trade confirmation.