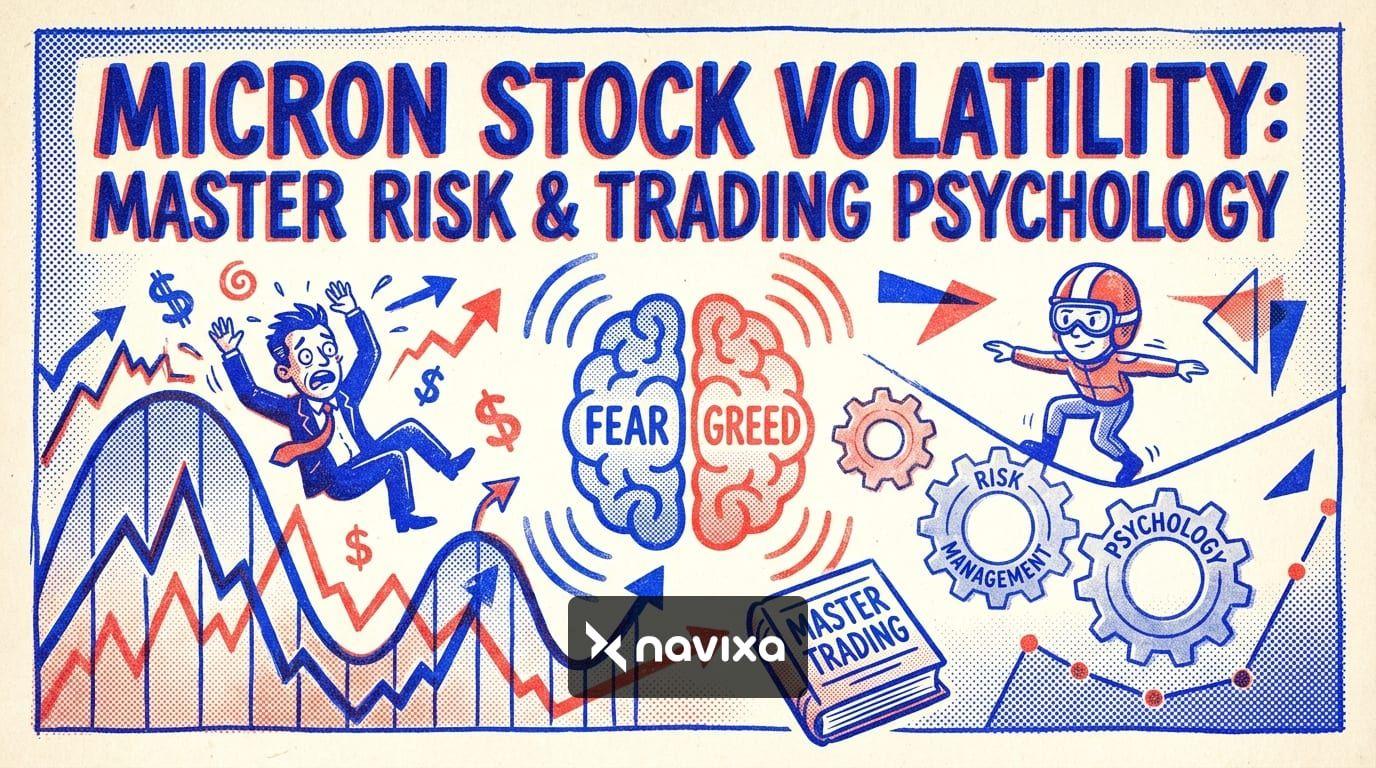
trading psychology & risk management
Micron Stock Volatility: Master Risk & Trading Psychology
- May 6, 2026
- 11 min read
The artificial intelligence revolution has radically transformed the global semiconductor landscape, pushing legacy chipmakers into unprecedented territory. Micron Technology (MU) is a prime example of this monumental shift. Operating at the very epicenter of the AI hardware boom, Micron stock has delivered one of the most extraordinary rallies in the technology sector, surging well past its historical ceilings and recently breaching the $600 mark.
Driven by explosive, unyielding demand for high-bandwidth memory (HBM), the company recently posted a jaw-dropping fiscal Q2 revenue of $23.9 billion—a near 196% year-over-year increase. More impressively, their non-GAAP earnings per share hit $12.20 alongside record gross margins of 75%. Management's guidance points to an even higher $33.5 billion in Q3 with margins expanding to roughly 81%. However, with parabolic, gravity-defying price appreciation comes extreme market volatility. Navigating these aggressive price swings requires more than just reading earnings reports; it demands a deep mastery of risk management and trading psychology.
- Micron stock has experienced staggering year-to-date growth, driven entirely by sold-out HBM capacity for global AI data centers.
- Extreme price appreciation naturally brings heightened volatility, requiring strict, systematic risk management protocols.
- The psychological challenge of holding highly volatile tech stocks rivals the intensity of trading major digital assets.
- Utilizing technical indicators and dollar-cost averaging (DCA) can effectively mitigate the risks of sudden, aggressive market drawdowns.

The AI Memory Supercycle: Boom or Bust?
Traditionally, the memory chip manufacturing sector was notorious for being a cyclical, boom-and-bust industry. Supply gluts routinely crushed profit margins, and consumer demand for smartphones and personal computers dictated the cycle. But artificial intelligence has fundamentally recast memory from a commoditized component into a scarce, strategic asset.
High-Bandwidth Memory (HBM) is the critical bottleneck for massive AI accelerators. Powering next-generation hardware—like Nvidia's Blackwell and the highly anticipated Vera Rubin architectures—requires specialized DRAM stacked alongside the GPUs. Micron is one of only three global HBM suppliers (alongside Samsung and SK Hynix) and the sole American manufacturer. This geographic and technological moat is incredibly powerful. The company has publicly confirmed that its entire HBM supply is completely sold out through the calendar year, with vast portions of its future capacity already locked into multi-year, non-cancellable agreements.
This structural shift forces institutional traders to entirely reprice the stock, leading to wild, unpredictable price swings as the market attempts to find a fair valuation. Because billions of dollars are pouring into AI infrastructure, the macroeconomic environment plays a pivotal role in sustaining this momentum. Traders must pay close attention to how external factors, such as crypto and macro GDP impacts, influence broader technology spending and global liquidity.
| Market Feature | Traditional Memory Cycle | AI-Driven HBM Supercycle |
|---|---|---|
| Core Demand Driver | PCs, Smartphones, Consumer Electronics | AI Data Centers, Cloud Infrastructure, GPUs |
| Supplier Pricing Power | Low (Commoditized, Highly Cyclical) | High (Structural Scarcity, Completely Sold Out) |
| Gross Profit Margins | 30% – 45% (Historically variable) | 75% – 81% (Record-breaking highs) |
| Revenue Visibility | Short-term, heavy reliance on spot markets | Multi-year locked supply agreements |
Market Analysis & Trading Psychology
Trading a high-momentum stock that has skyrocketed by hundreds of percent in a single year requires an iron-clad mindset. For context, the frantic momentum currently seen in leading AI hardware stocks rivals the manic energy of digital asset markets. When you consider that the global cryptocurrency market cap hovers near $2.78 trillion, with Bitcoin fluctuating above $81,000 based on narrative momentum, it becomes clear that extreme volatility is the new normal for any asset experiencing a supercycle.
The first psychological hurdle every trader faces is the "fear of missing out" (FOMO). When you see a company reporting $12.20 in earnings per share and projecting 81% gross margins, the emotional impulse to buy at any price can feel overwhelming. However, buying blindly into parabolic tops is a fast track to severe portfolio damage. Mastering your emotions involves overcoming intense market FOMO by setting strict, data-driven entry parameters rather than frantically chasing green candles on a chart.
Another dangerous cognitive trap is anchoring bias. Traders often anchor their expectations to past prices. If a stock was trading at $100 just a year ago and is now crossing $600, traders might falsely believe it is "too expensive" and short the stock prematurely, getting crushed by the ongoing momentum. Conversely, if it drops from $600 to $450, they might assume it is a "bargain" without analyzing whether the underlying AI infrastructure narrative has shifted.
**Beware of Valuation Traps and Drawdowns** While forward price-to-earnings multiples may look temporarily attractive relative to staggering growth rates, cyclical hardware stocks can still experience rapid 30-40% drawdowns if hyperscaler infrastructure spending cools. Never trade without a defined exit plan.

Technical Analysis & Navigating Price Swings
Fundamental analysis tells you *what* to buy, but technical analysis tells you *when* to buy it. In a high-volatility environment, relying solely on stellar earnings reports is simply not enough. You must understand how to map out the financial battlefield and identify where institutional buyers and sellers are most likely to react.
Identifying historical support and resistance zones is the absolute foundation of trading volatile assets. When a stock breaks past a major psychological level—such as the $500 mark—that previous barrier often flips to become a new support floor. By combining momentum oscillators like the Relative Strength Index (RSI) with volume profiles, traders can effectively spot short-term exhaustion points in the trend. Applying robust technical analysis and key levels ensures that you are entering trades based on empirical, verifiable data rather than gut feeling or social media hype.
Traders should also heavily utilize Moving Averages (MAs). In explosive uptrends, the 20-day and 50-day Exponential Moving Averages (EMAs) often act as dynamic support levels. When the price strays too far above the 20-day EMA, it is often a sign of temporary overextension, signaling that a mean-reversion pullback is imminent. Patient traders will wait for the price to consolidate near these averages before initiating a new position.

Actionable Strategies and Risk Management
So, how do you safely build a position in a runaway market without exposing yourself to ruinous drawdowns? The answer lies in methodical scaling and systematic strategy execution.
Rather than executing a massive lump-sum purchase at all-time highs, many successful traders utilize a smart DCA strategy (Dollar-Cost Averaging) designed specifically for trend continuation. By breaking your total intended investment into smaller, strategic tranches, you can accumulate shares during the inevitable market pullbacks, smoothing out your average entry price over time.
Furthermore, analyzing the historical price behavior of other leading semiconductor companies can provide a significant trading edge. For instance, studying a comprehensive QCOM stock trading strategy can reveal deep behavioral similarities in how legacy chipmakers react to broader supply chain news, geopolitical tariff shifts, and unexpected earnings beats.
Finally, strict adherence to the 1% or 2% rule is mandatory. This rule dictates that you should never risk more than 1-2% of your total account equity on any single trade setup. If your stop-loss is triggered, the capital impairment is mathematically negligible, allowing you to survive the volatility and trade another day.
**Position Sizing is Your Best Defense** In high-volatility environments, restrict your initial position size to a smaller percentage of your total portfolio. This deliberate sizing allows you to absorb wider, more forgiving stop-losses without risking catastrophic portfolio damage.

Conclusion
Trading Micron stock during the current AI supercycle is a rigorous masterclass in balancing explosive fundamental growth with extreme market volatility. The underlying numbers—$23.9 billion in quarterly revenue, unprecedented 81% gross margins, and entirely sold-out HBM capacities—paint the picture of a once-in-a-generation technology shift. However, the stock market is a forward-looking mechanism, meaning that immense optimism is already heavily priced into the current chart.
To survive and thrive in this landscape, traders must completely divorce their emotional reactions from their execution strategy. Relying on verified technical levels, employing systematic dollar-cost averaging, and strictly managing your position sizes will protect your capital when the inevitable pullbacks occur. If you are ready to take your technical execution and psychological resilience to the next level, explore Navixa strategies to heavily refine your market edge, or start trading with Navixa to systematically automate your risk management protocols.
Frequently Asked Questions
Why is Micron stock experiencing such extreme volatility right now?
Micron is positioned at the absolute epicenter of the global AI hardware build-out. Because it is one of the very few global suppliers of the High-Bandwidth Memory (HBM) required for modern AI GPUs, extreme demand shifts, geopolitical supply chain news, and massive hyperscaler capex announcements cause rapid, aggressive repricing in its stock.
Is the semiconductor memory market still cyclical?
Historically, the DRAM and NAND markets were fiercely cyclical, driven mostly by consumer PC and smartphone demand. However, the modern AI era has introduced multi-year, non-cancellable contracts for data center HBM. This has created a much more structural, long-term demand base, though macroeconomic and oversupply risks could still trigger future cyclicality.
How does trading psychology impact tech stock investments?
Rapid price appreciation often triggers powerful emotional responses like the "fear of missing out" (FOMO), leading retail investors to blindly buy at cycle tops. A disciplined, professional trading psychology prevents this emotional decision-making, ensuring that all entries and exits are strictly based on verifiable technical structures and fundamental data rather than hype.
What is the safest way to enter a highly volatile tech stock?
The safest method is utilizing a structured Dollar-Cost Averaging (DCA) approach combined with technical support validation. Instead of investing all your capital at once, you buy smaller tranches of shares specifically when the stock pulls back to established moving averages or historical support zones, thereby mitigating the risk of buying a local top.